.png)


.png)
The major stock market indexes eked out gains Friday but scored strong gains for a third straight week as Treasury yields continued to fall. The advance has been sparked by surprisingly tame U.S. inflation data that gave hope to investors that the Federal Reserve's string of interest rate hikes was in the rearview mirror. The yield on the benchmark 10-year Treasury note tumbled 19 basis points for the week to 4.44%. In the stock market, the Dow Jones index advanced 1.9%, the SP500 rose 2.2%, and the Nasdaq climbed 2.4%. In the past three weeks, the Dow gained 7.8%, the SP500 surged 9.6%, and the Nasdaq jumped 11.7%. The longer end 10-year Treasury yield ended the week at 4.44% and the shorter end 2-year yield closed at 4.90%
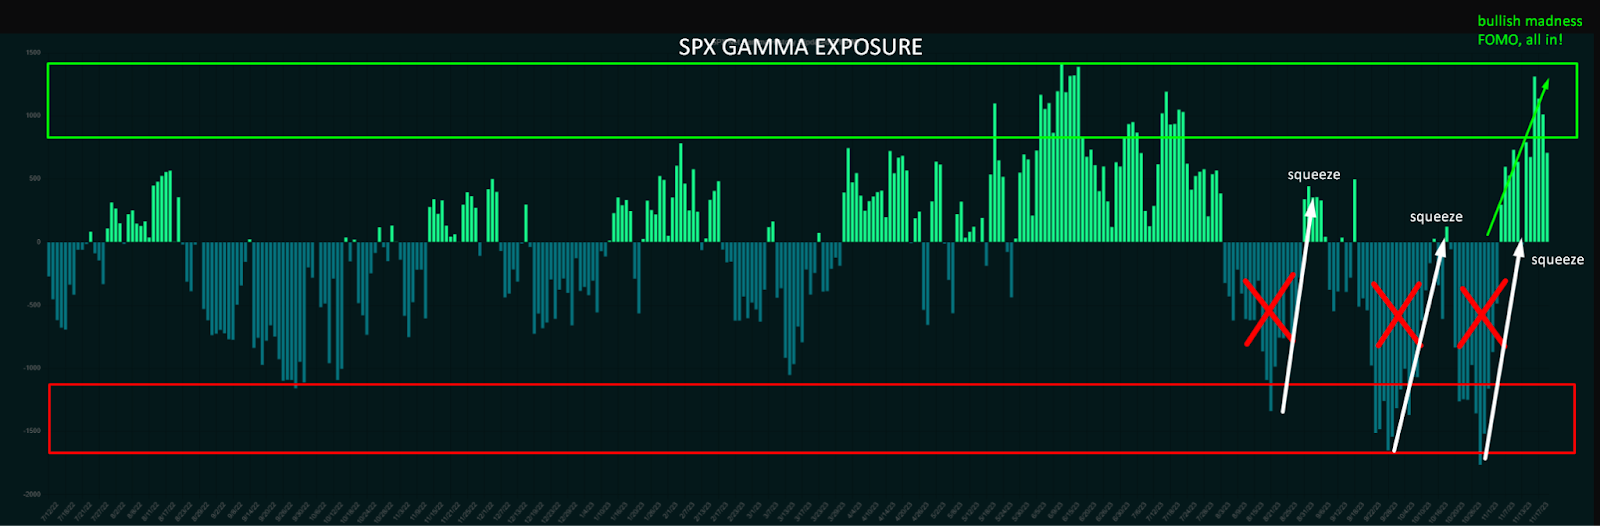
The October CPI was lower than expected with the headline inflation at 0% MoM, and 3.2% YoY. This was enough to put the fire under the stock market, and not only to cement the notion that the Fed is done, but also suggest that the Fed could cut more aggressively in 2024 as the disinflationary process continues. Essentially, the market is now pricing a faster than expected disinflationary process in 2024 and still growing economy, the childish softlanding narrative is back in force. The expectation of more aggressive Fed cuts in 2024 is causing the "uneducated" money from the sidelines to enter the stock market due to the "fear of missing out" (FOMO)
Later in the week, President Biden signed a short-term government funding bill passed by Congress, avoiding a federal shutdown and pushing the debate over the federal budget into next year. The bill will maintain government spending at current levels for two more months, giving lawmakers time to negotiate appropriations bills for the rest of the fiscal year. The measure also didn't include the $106B that the White House requested for Israel and Ukraine aid, as well as humanitarian funding for Palestinians and other supplemental requests
The holiday-shortened week will include a flurry of earnings reports just before Thanksgiving. The headliner will be Nvidia, which has been on an AI-fueled rally of late. The economic calendar will be dominated by global flash PMIs for November and the durable goods order report, and the U.S. interest rate watchers will also have their eyes on the Federal Reserve's release of minutes from the FOMC meeting and the European Central Bank's accounting of its last meeting.
Bitcoin remained stable between $35,100 and $37,900 this week, with a minimal -1% change over the past seven days. Meanwhile, the anticipation of potential Bitcoin ETF approval in the US has increased demand, causing a surge in transaction fees. As of Nov. 16, the average transaction fee is $18.69, up 746% from a year ago.
Macro y news
This Week's Major U.S. Economic Reports:

Earnings for next week:

U.S. Macro data
U.S. CPI and PPI
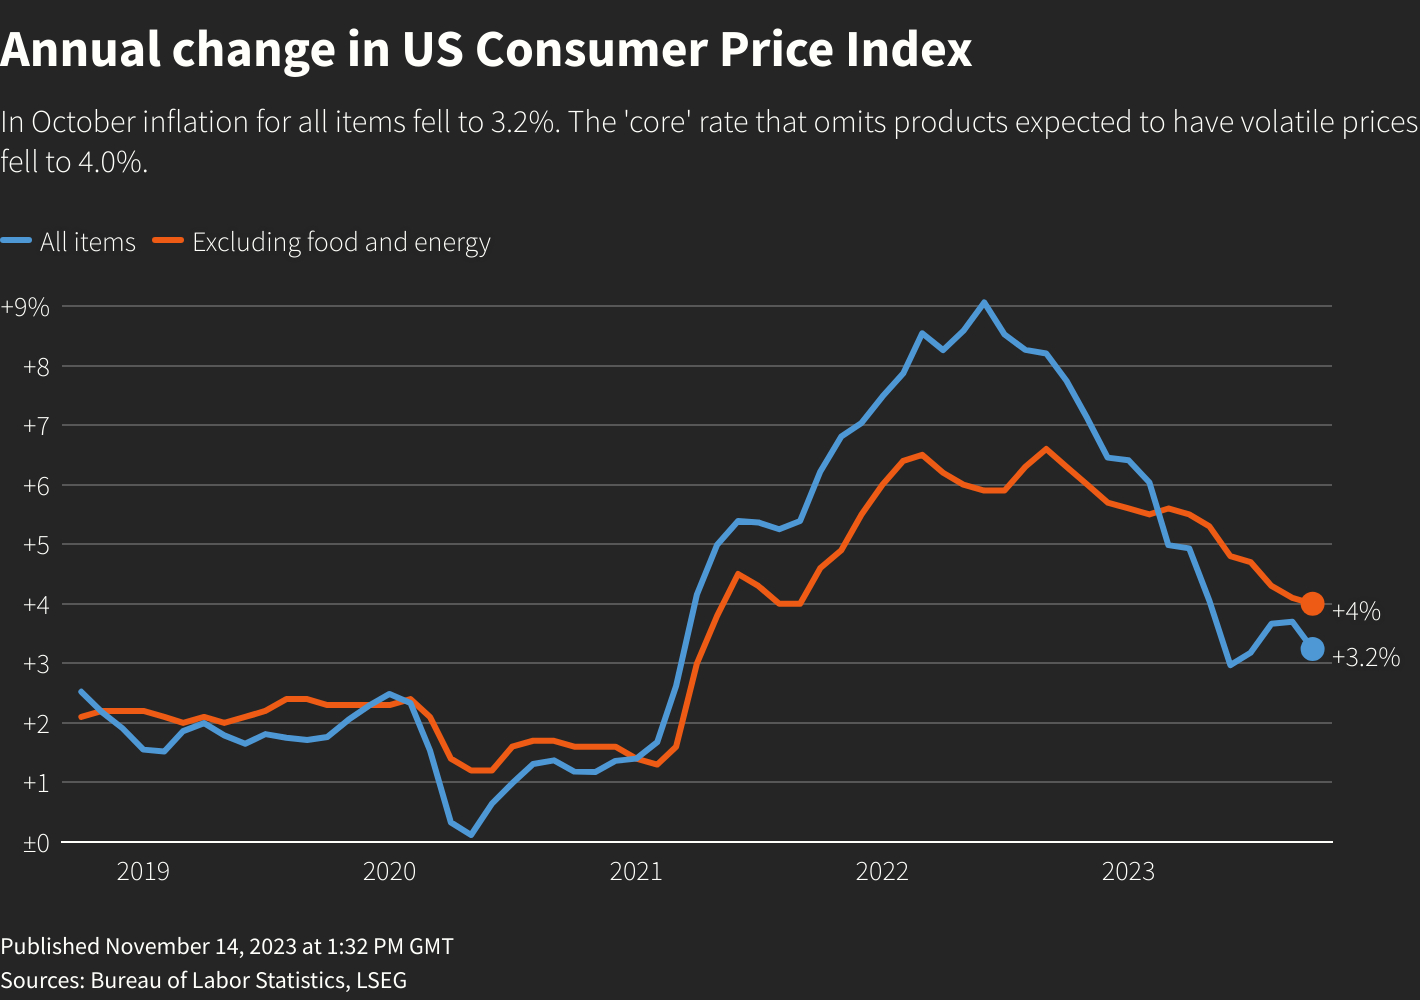
After a brief acceleration in late summer, inflation resumed its downward trajectory in October. The headline consumer price index (CPI) was unchanged last month, with the annual rate falling from 3.7% to 3.2%, helped by a sizable drop in gas prices. Oil prices are now down 20% from their September high and will continue to be a drag on next month's data1. Core CPI, which excludes food and energy and is a better indicator of the underlying trend, also moved lower, from 4.1% to 4.0%. Though still well above the Fed's target, this was the lowest reading in two years.
A look under the surface reveals some encouraging trends. Prices for goods outright declined in October for the fifth consecutive month, largely driven by falling used car and truck prices. Private wholesale data suggest further declines in used car prices ahead. Outside of autos, the improvement in supply chains and lower transportation costs are consistent with decreasing prices for other goods. Elsewhere, shelter inflation remains the biggest contributor to overall CPI, but there was a notable step down in the pace of monthly increases in October.

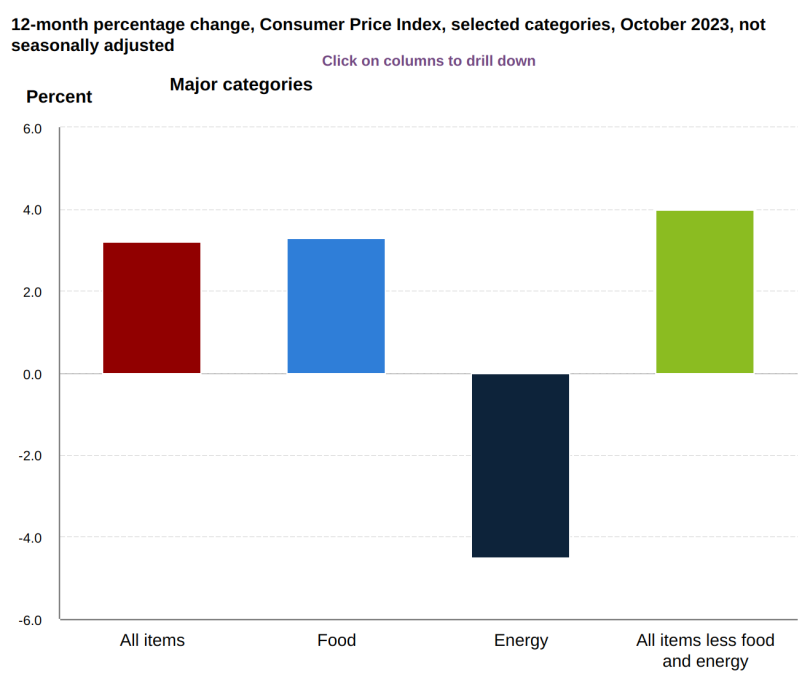
Energy led the way lower year-over-year, with food and core continuing to rise.
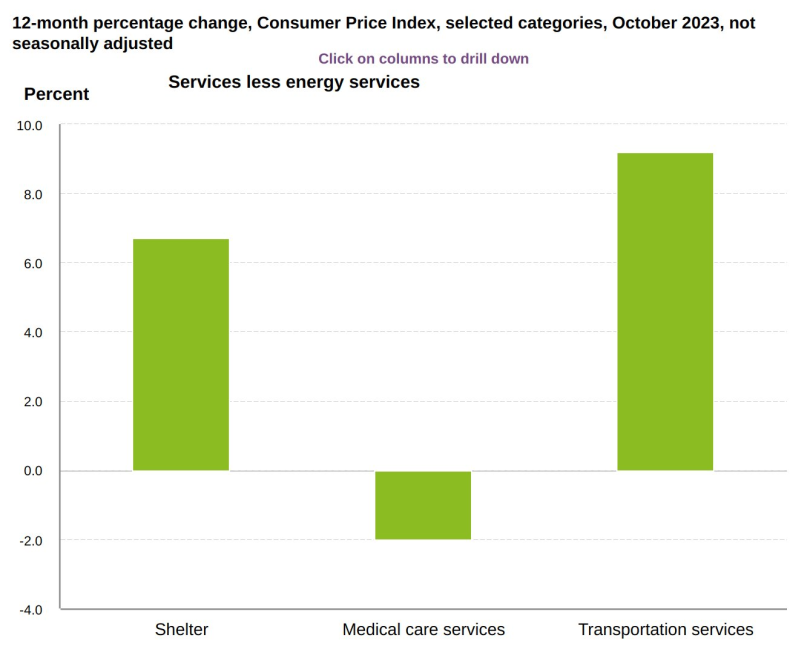
Shelter and transportation continue to rise.
Prices paid to US producers unexpectedly declined in October by the most since April 2020, adding to evidence of abating inflationary pressures across the economy. The producer price index for final demand decreased 0.5% from a month earlier, a sharp slowdown that’s largely reflective of a decline in gasoline prices. Excluding food and energy, the so-called core PPI was unchanged, government data showed. From a year ago, the overall measure was up 1.3%, while the core gauge posted the smallest annual increase since the start of 2021.

The cooling inflation signals fostered another drop in long-term Treasury yields, with the benchmark 10-year note touching an intraday low of around 4.40% on Friday, its lowest level since mid-September. U.S. investment-grade corporate bonds generated strong performance going into Friday, supported by falling U.S. Treasury yields. Meanwhile, high yield bonds tracked equities higher following the release of the encouraging inflation data, and the leveraged loan market maintained its recent firmness as loan investors mainly focused on earnings and individual company headlines.
Futures now show a 0% chance of additional rate hikes with rate cuts beginning in May 2024. Prior to the CPI report, there was a 30% chance of at least one more rate hike ahead. Rate cuts were expected to begin in June 2024.Now, markets are pricing-in at least 4 rate CUTS in 2024. Meanwhile, just last week Fed Chair Powell said he is “not confident” monetary policy is “sufficiently restrictive." Markets are betting that the Fed is done.

U.S. economic growth slowdown
Last week we saw that October retail sales fell, but less so than expected (-0.1% vs. -0.3%). The modest decline was driven by a drop in gasoline sales, and the more important control-group sales (excludes gasoline, autos, building materials, and food services), which feeds into the GDP calculation, rose 0.2% month-over-month following an upward revised 0.7% gain1. The upshot is that while the consumer has been the strongest cylinder in the economic engine, the consumer is gradually slowing because there is a little less dry powder to spend.

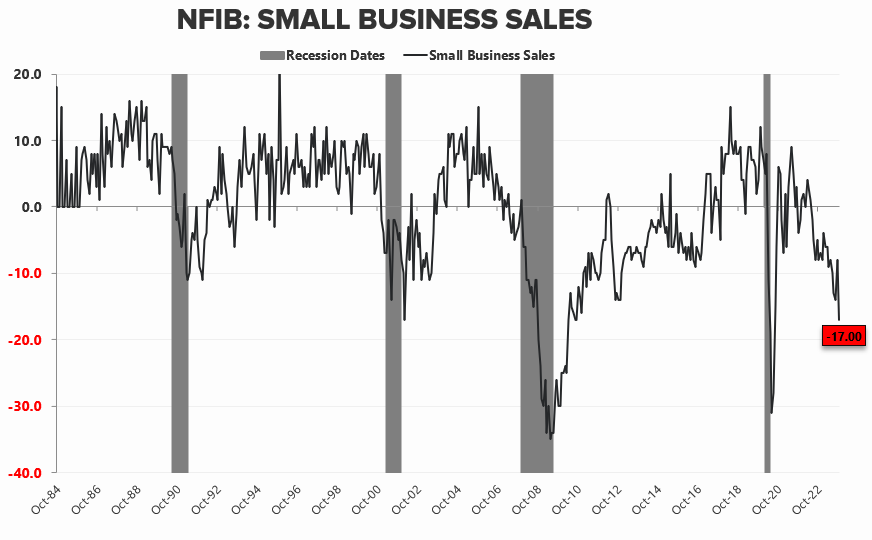
Small business sales heading to deep recessionary territory.
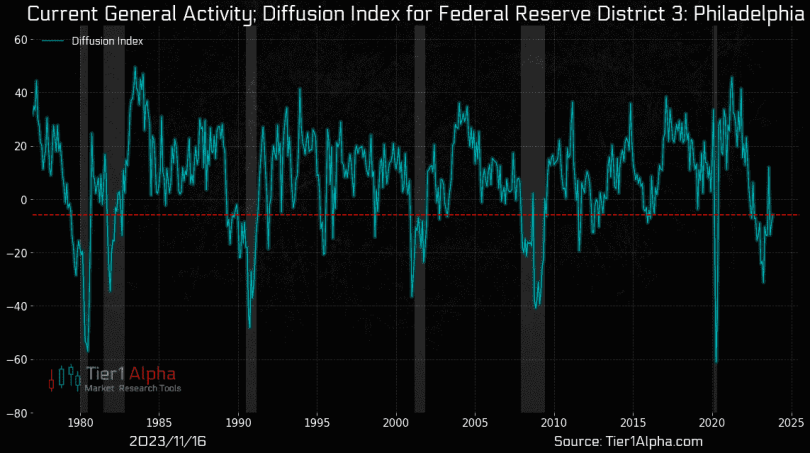
Manufacturing remains in the red. The Philly Fed manufacturing index stayed negative for November, marking the 16th time in 1.5 years the index registered below 0. November's report showed declines in:
- New orders
- Current shipments
- Employment index
- Prices paid index
Manufacturers are tempering expectations for the 6 months ahead. Understandable given the index has been below 0 for 4.5 quarters.
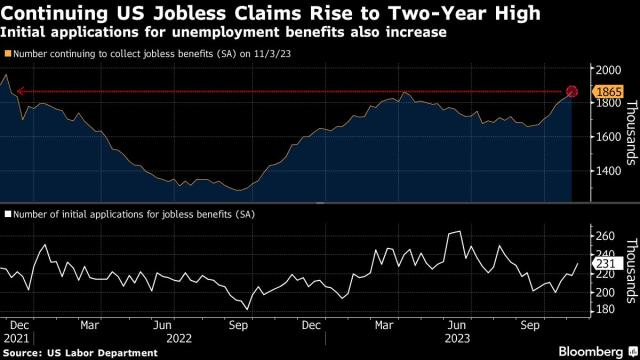
Continuing applications for US unemployment benefits rose to the highest level in almost two years, underscoring the increasing challenges unemployed workers are facing in finding new jobs.
Recurring jobless claims, a proxy for the number of people continuously receiving unemployment benefits, jumped to 1.87 million in the week ended Nov. 4, according to Labor Department data out Thursday. That marked an eighth straight week of increases. Initial jobless claims also rose, to 231,000 in the week ending Nov. 11. That was the highest since August.
Although it’s difficult to draw conclusions from volatile weekly numbers, the rise in jobless claims, combined with other data out this week, indicate some cooling in the labor market, in price pressures and in consumer spending.
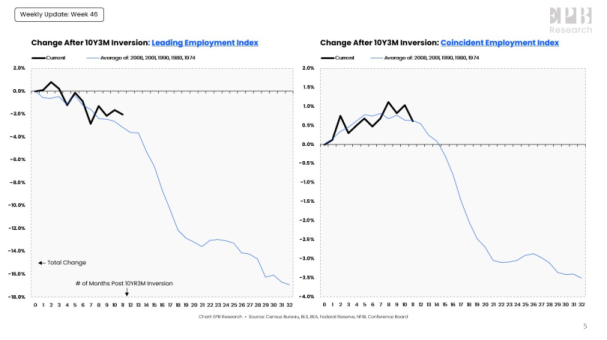
Continuing jobless claims are now at the highest level since the 10y3m curve inverted. The cycle follows the normal path.

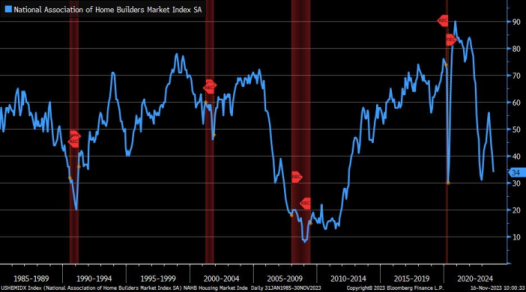
Sharp decline for November NAHB Home Housing Market Index, now down to 34 vs. 40 est. and 40 in prior month. Declines in all major categories, with largest in single-family sales.
Eurozone macro data
European Central Bank (ECB) President Christine Lagarde said at a Financial Times event that policymakers expected inflation to pick up at the start of next year as base effects drop out of the annual comparison. Lagarde hinted, however, that even if inflation accelerates again, another interest rate increase may not be required: “We are at a level where we believe that, if kept long enough, and this long enough is not trivial, will take us to the 2% medium-term target.” She added that there will probably be no change over the “next couple of quarters.”
Elsewhere, Vice President Luis de Guindos also pushed back against market expectations for rate cuts. He reiterated that monetary policy would be at a sufficiently restrictive level for as long as necessary to bring inflation back to target.
October witnessed the Eurozone’s inflation rate drop to 2.9%, the lowest in over two years. This significant decline is primarily attributed to a reduction in energy prices. Core inflation also experienced a decrease, falling to 4.2% from 4.5% in September. Despite these changes, the European Central Bank’s (ECB) medium-term inflation target of 2% continues to be surpassed, indicating that the economic landscape isn’t entirely stable yet.

Eurozone industrial production declined broadly in line with expectations in September, wiping out a rise in August as output of consumer goods dropped sharply in the month.The European Union's statistics office Eurostat said on Wednesday that industrial production in the 20 countries sharing the euro fell by 1.1% month-on-month in September for a 6.9% year-on-year decline. The latter was the steepest drop since June 2020, at the height of the COVID-19 pandemic.

UK macro data
Annual consumer price inflation in the UK slowed more than expected to 4.6% in October from 6.7% in September, prompting financial markets to increase their bets on interest rate cuts next year. Core inflation, which excludes food and energy, and services inflation also decelerated.

Before the data were released, Bank of England Chief Economist Huw Pill said that an expected drop in inflation would still leave it “much too high” relative to the 2% target.
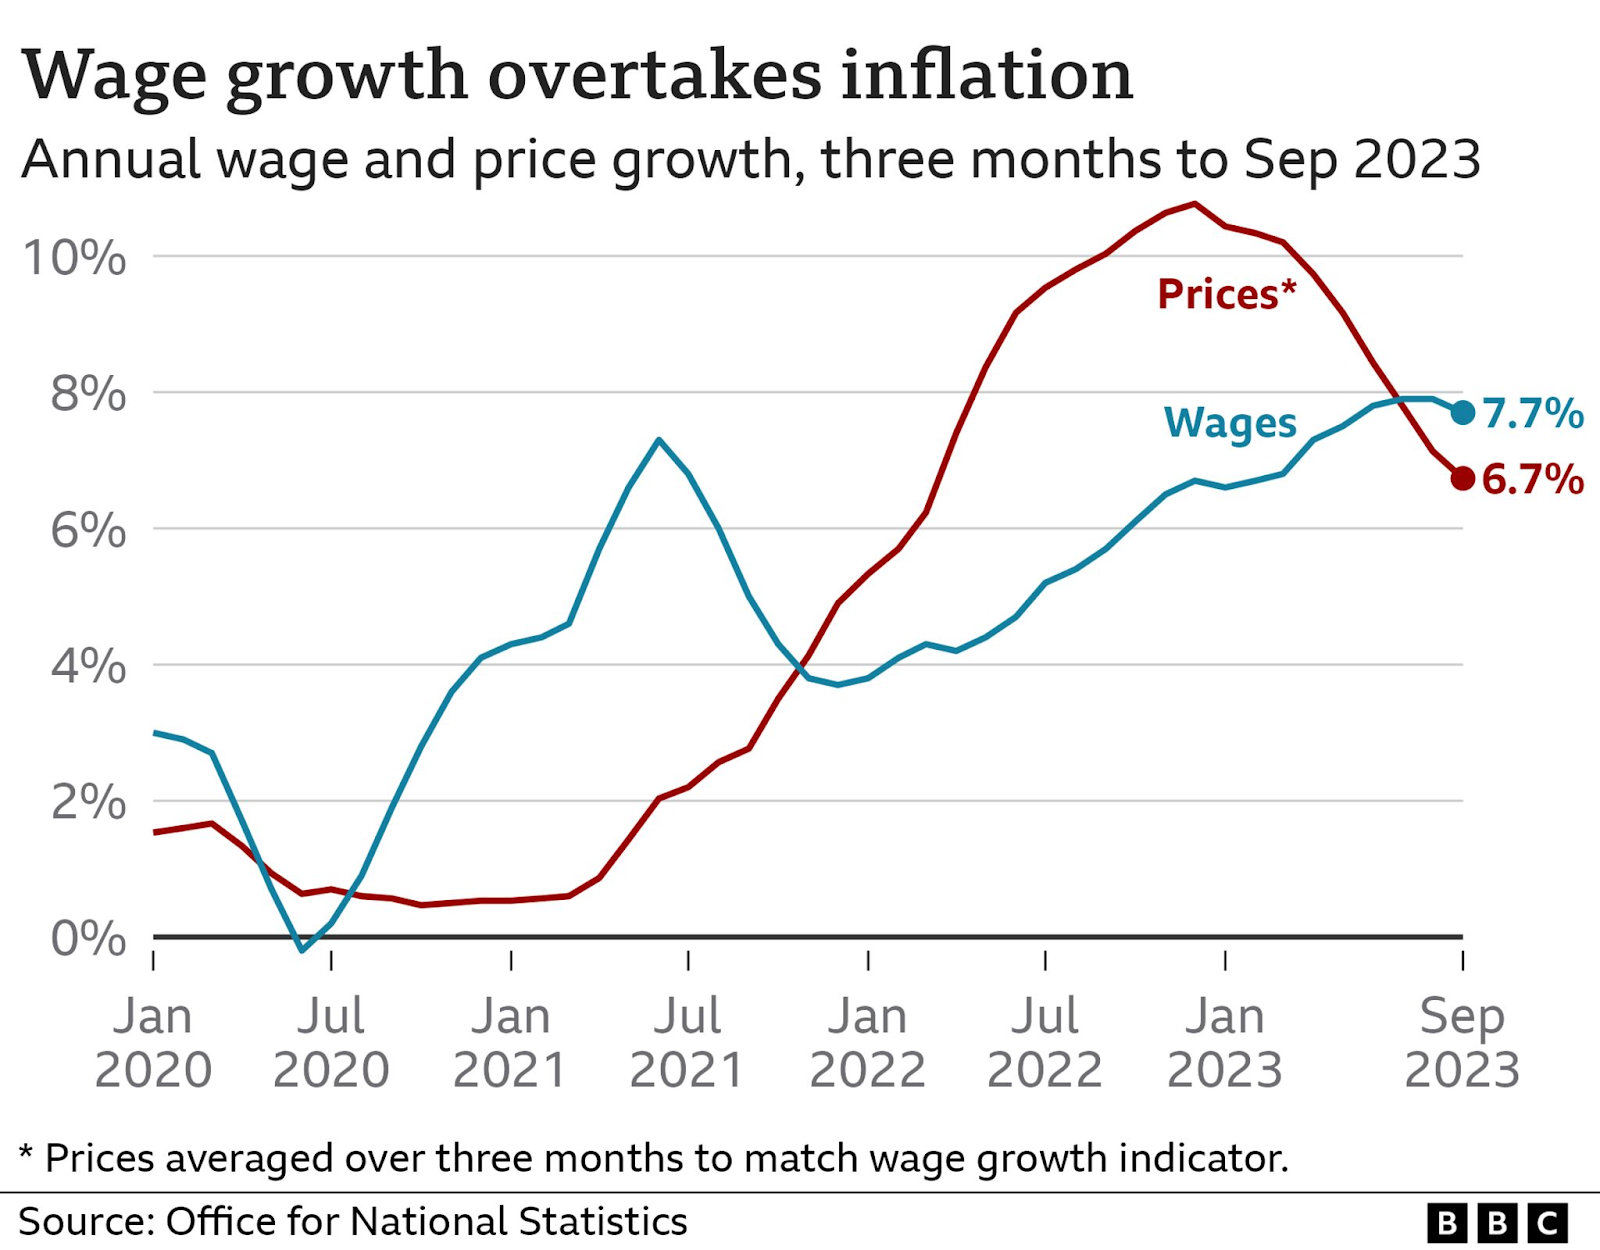
The UK labor market remained tight. Wages, including bonuses, rose 7.7% in the three months through September compared with 7.9% in the previous period. And the Office for National Statistics estimated that unemployment was unchanged at 4.2% in the three months through October.
Japan macro data
Japan’s economy slipped back into reverse over the summer, pointing to the fragility of the country’s recovery and backing the case for continued Bank of Japan easing and the government’s recent economic package. Gross domestic product shrank at an annualized pace of 2.1% in the third quarter, largely on the back of falling business spending and higher imports that dragged on the economy, the Cabinet Office reported Wednesday. The contraction follows two straight quarters of growth and suggests that Japan’s economic recovery remains fragile.
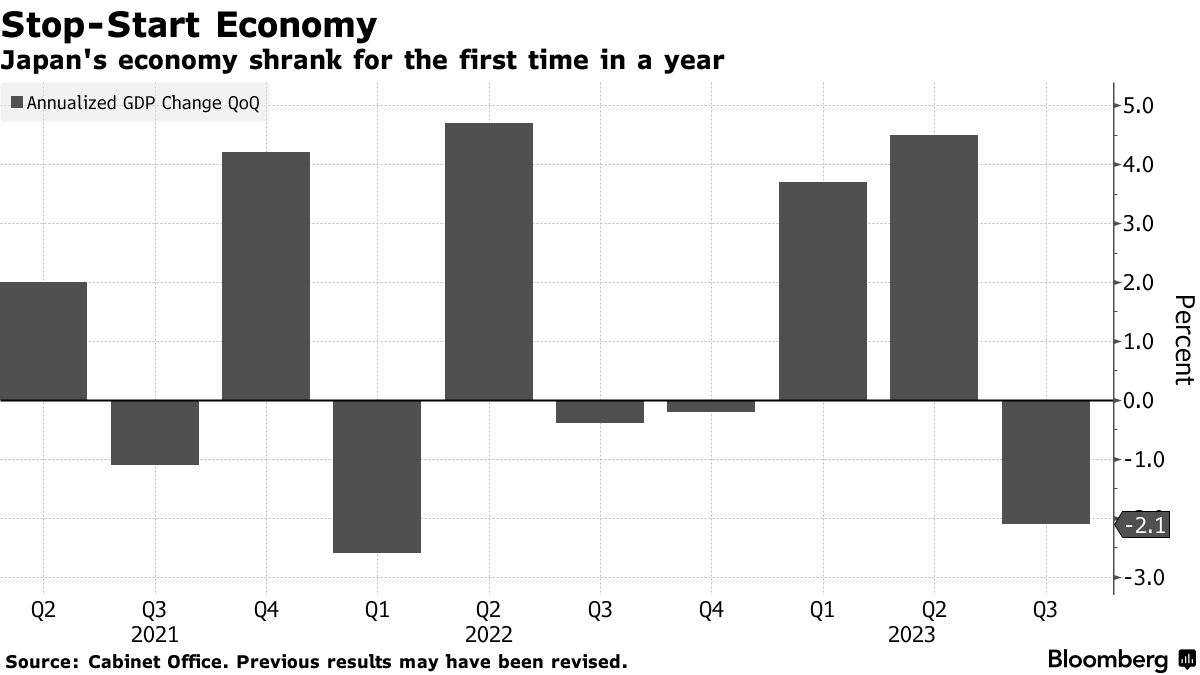
An expected increase in consumer spending also failed to materialize. The contraction was much deeper than economists’ estimate of a 0.4% shrinkage.
There were some signs of easing inflation in October, as Japan’s corporate goods price index, which measures wholesale inflation, rose 0.8% year over year, down from 2.2% in September. The slowdown was due largely to falling global commodity prices.
The yield on the 10-year Japanese government bond (JGB) fell to 0.72% from 0.85% at the end of the previous week, tracking weakness in U.S. bond yields. This prompted the Bank of Japan (BoJ) to reduce the offer amounts for its regular buying of JGBs, with which it seeks to limit volatility in yield movements.

Anticipation of an end to U.S. monetary policy tightening lent support to the yen, which finished the week higher, in the JPY 149 against the USD range. However, the Japanese currency continued to hover around a 33-year low as investors remain focused on interest rate differentials. Japan’s government has repeatedly said that it will take every possible measure in response to volatility in the foreign exchange market.
Despite heightened concerns about the economic impact of the weak yen, BoJ Governor Kazuo Ueda asserted during the week that there are both positives and negatives, namely, it helps boost exports and global firms’ profits but poses a drag in the form of higher prices for imports.
China macro data
The highly-anticipated meeting between President Biden and his Chinese counterpart Xi Jinping ended with agreements to open high-level dialogue, while Xi called on Biden to lift unilateral sanctions and provide a non-discriminatory environment for Chinese companies. Other issues went unresolved and tensions were apparent. As Xi met with American business executives Wednesday evening, Biden highlighted the difference between the two economic systems during a press conference, repeating comments from earlier this year that described Xi as a "dictator. "
Official data for October offered a mixed picture of China’s economy. Industrial production and retail sales grew more than forecast last month from a year earlier, while fixed asset investment growth missed estimates due to a dip in infrastructure growth and real estate investment.

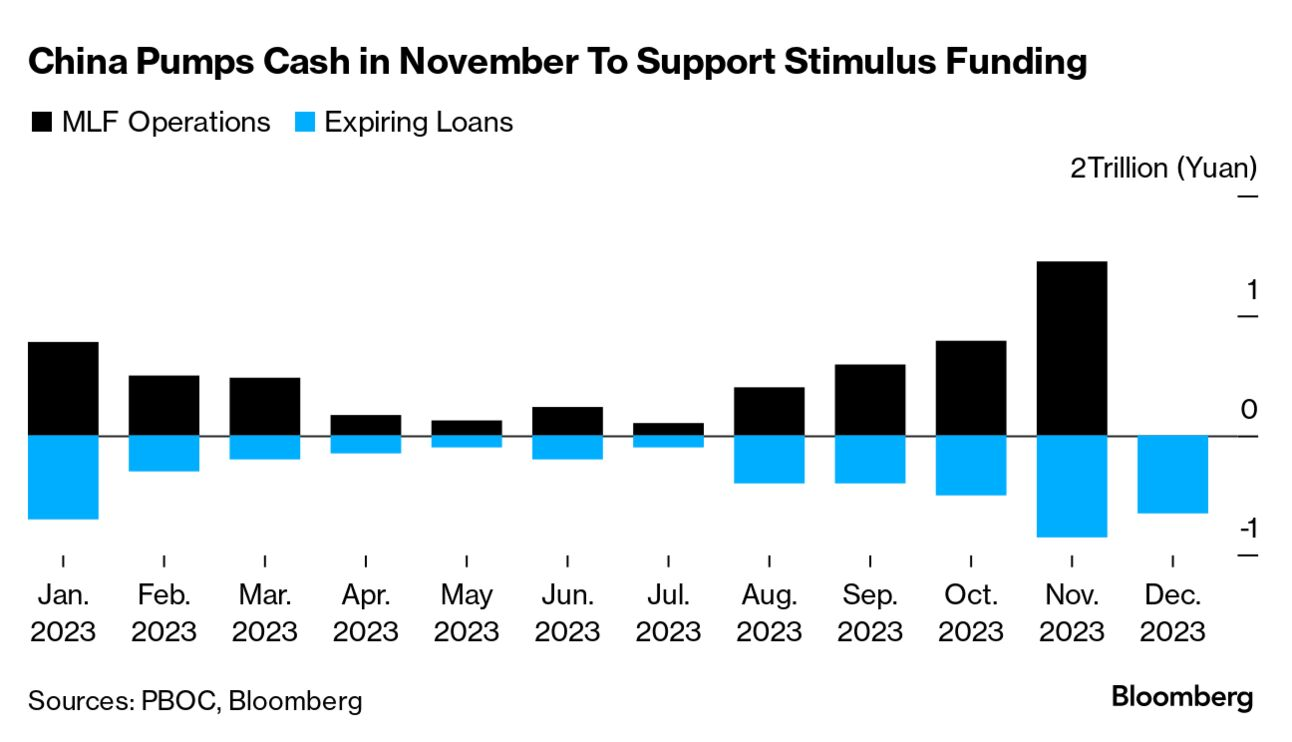
In monetary policy news, the People’s Bank of China (PBOC) injected RMB 1.45 trillion into the banking system via its medium-term lending facility compared with RMB 850 billion in maturing loans, its largest net injection since December 2016. The medium-term lending facility rate was left unchanged as expected. Liquidity injections are seen as a part of the central bank’s ongoing efforts to counter economic headwinds as weak consumer confidence and property market woes remain a drag on the country’s post-pandemic recovery.
Many economists predict that the PBOC will step up policy easing for the rest of 2023, including a possible cut to its reserve ratio requirement, as the government ramps up measures to boost China’s economy.
Official readings showed that the housing market’s slump deepened in October. Investment in property development fell by an above-consensus 9.3% in the first 10 months of the year compared with a 9.1% decline in the January to September period, according to the National Bureau of Statistics. Property sales slumped by 7.8% between January and October versus the same period in 2022.


Crypto News
=> The U.S. Securities and Exchange Commission (SEC) is delaying a decision on an application by Hashdex to convert its existing bitcoin futures exchange-traded fund (ETF) into a spot vehicle. The agency has also delayed action on Grayscale's attempt to launch a new futures-based ether ETF.Hashdex filed to convert its bitcoin futures ETF into a spot bitcoin ETF in September. Grayscale (a subsidiary of CoinDesk parent Digital Currency Group) filed for its ether futures ETF that same month. Both filings faced initial deadlines of Nov. 17 for a decision, but the SEC today said it was extending this window, according to a pair of Wednesday filings.
The delays come amid heightened anticipation of a spot bitcoin ETF approval by the federal regulator, which has so far rejected every attempt to list such a product for the general investing public. Over a dozen companies have filed to launch spot bitcoin ETFs in 2023, with several others now applying for similar products exposed to ether, the second-largest cryptocurrency by market capitalization.
The regulator has yet to indicate how it might ultimately rule on the latest slate of applicants. Previous rejections raised concerns about the susceptibility of bitcoin to market manipulation and a lack of surveillance-sharing agreements, among other concerns. Applicants now say these concerns have been addressed or are no longer relevant after the approval of bitcoin futures ETFs, a view an appeals court echoed earlier this year. The SEC has so far delayed making final decisions on these applications.
=> The SEC has postponed its decision on the Global X Bitcoin Trust’s application to list a spot bitcoin exchange-traded fund (ETF)
=> A group of lawmakers asked U.S. President Joe Biden and Treasury Secretary Janet Yellen to quantify to what extent terror group Hamas might be using cryptocurrency to raise funds, hours before members of the House Financial Services Committee were set to hold a hearing on the issue.
The Tuesday letter cites recent Wall Street Journal reporting and blog posts from crypto analytics firms, saying there is a concern about Hamas receiving crypto funds but that "it remains unclear" the extent to which this is a problem.
=> The International Organization of Securities Commissions (IOSCO) has released a report containing policy suggestions for crypto and digital asset (CDA) markets. The report aims to formulate a unified global regulatory approach to address the risks posed by centralized crypto-asset intermediaries.
The suggestions establish a distinct and robust global regulatory foundation, ensuring CASPs adhere to the business conduct standards applicable in conventional financial markets. Moreover, the report identifies several critical domains, including conflicts of interest, market manipulation, insider trading, fraud, custody, client asset protection, cross-border risks, and retail distribution.
=> Cboe Digital announced plans to launch trading and clearing in margin futures on Bitcoin and Ether, beginning January 11, 2024. With this launch, Cboe Digital will become the first U.S. regulated crypto native combined exchange and clearinghouse to enable both spot and leveraged derivatives trading on a single platform. Committed to bringing trust, transparency and responsible innovation to the crypto spot and derivatives markets, Cboe Digital presents an intermediary-inclusive model, ensures separation of duties to avoid conflicts of interest, and uses an integrated exchange-clearinghouse model that will allow it to potentially bring more unique and groundbreaking offerings in 2024.
=> Lee Jeong-hoon, former chair of South Korea's major cryptocurrency exchange, Bithumb, is at the center of a legal battle and may be sentenced to eight years in prison. Prosecutors allege that Lee aimed to benefit from exchange tokens by bypassing financial regulations. The case dates back to October 2018, when Lee allegedly defrauded $70 million during negotiations for Bithumb's acquisition. The verdict is scheduled for January 18, 2024, and the outcome of the appeal will have significant implications for Bithumb's future, cryptocurrency exchanges' governance, and regulatory scrutiny.
=> BlackRock, the world's largest asset manager, has officially filed for a spot Ether exchange-traded fund (ETF) with the SEC. The ETF, named iShares Ethereum Trust, aims to track the performance of Ether's price. BlackRock's move follows its registration of the iShares Ethereum Trust with Delaware's Division of Corporations.
=> Paxos crypto infrastructure firm has received in-principle approval from the Monetary Authority of Singapore (MAS), the country's financial regulator, for its new entity, Paxos Digital Singapore.
This approval allows Paxos to offer digital payment token services and issue a USD stablecoin under MAS's proposed stablecoin regulations. Once fully approved, Paxos plans to partner with enterprise clients to issue the stablecoin in Singapore. This move aims to meet the global demand for the U.S. dollar and provide a safe and regulated platform for users worldwide. Notably, Paxos was previously in charge of minting Binance's BUSD stablecoin, which is now being phased out.
=> Bankruptcy court allows bankrupt crypto companies FTX and BlockFi to negotiate their claims settlement. FTX debtors can now address BlockFi claims in the bankruptcy proceeding. FTX's collapse froze around $355 million of BlockFi's funds, with an additional $671 million owed by Alameda Research. Meanwhile, the court order states that #FTX debtors won't receive a distribution from BlockFi, and both parties must file for mediation promptly. Mediation will begin by December 24, 2023.
=> Traditional finance giants JPMorgan and Apollo have successfully collaborated with several blockchain firms to demonstrate a proof of concept for asset managers to tokenize funds on their preferred blockchain. JPMorgan's Onyx Digital Assets worked with interoperability layer Axelar, infrastructure provider Oasis Pro, and Provenance Blockchain to manage large-scale client portfolios, execute trades, and enable automated portfolio management of tokenized assets.
Oasis Pro facilitated the tokenization of assets, such as Apollo funds, on the Provenance Blockchain Zone. This initiative is part of Project Guardian, a collaborative effort led by the Monetary Authority of Singapore (MAS) and traditional finance institutions to explore opportunities and potential risks associated with decentralized finance. The announcement was made at Singapore's Fintech Festival. The demonstration also allowed wealth managers to purchase and rebalance their positions in tokenized assets across multiple chains.
The next several weeks will be very interesting for Bitcoin, here’s the latest ETF 19b-4 deadlines:

Cryptos: spot, derivatives and “on chain” metrics
Bitcoin and Ethereum experienced losses over the past week, their weekly performance showed a decline of 1.14% and 4.23%, respectively.
The overall crypto market presented a mixed picture with several altcoins registering varied movements. BNB rose by 1.27% to $244, and XRP made slight gains, increasing to $0.66 (up 0.85%). Cardano stood out with a notable increase of 4.09% to $0.33. In contrast, Dogecoin fell by 6.08% to $0.077. Solana displayed resilience over the week with a positive momentum of 2.18%, trading at $58. Polka Dot and Shiba Inu were among the cryptocurrencies that faced weekly declines, with Polka Dot down by 4.08%.
The top gainers included Render, Arweave, FTX Token, KuCoin Token, and Oasis Network, each posting significant returns within the last day. Stablecoins such as Tether and USD Coin managed to stay close to their pegged values, while Binance USD experienced a slight decrease.
The DeFi sector witnessed fluctuations with tokens like Avalanche and Chainlink seeing decreases in value, whereas Wrapped Bitcoin saw a marginal uptick. NFT assets generally faced downturns with Internet Computer and Immutable experiencing notable declines.
Despite these mixed performances across various cryptocurrencies and sectors, the global crypto market cap held steady at $1.39 trillion with a daily volume surge indicating robust trading activity.
Gainers / Losers last 7 days, block size volume.

Bitcoin
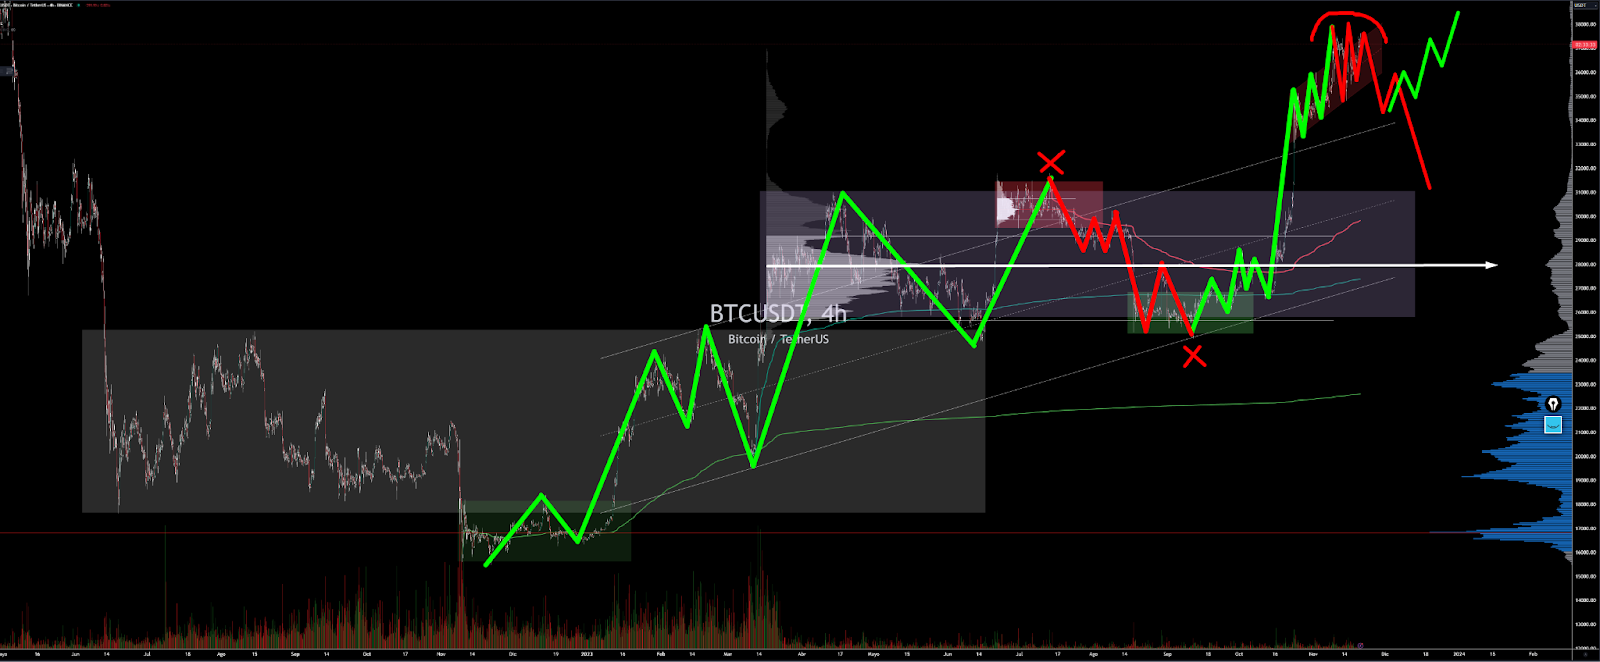
The market after a first bullish imbalance failure of the lower major structure managed to defend itself, broke through the $28100 VPOC and started a powerful breakout of the upper range. Demand has fully taken control, there is no doubt, however the verticality of the move and some overheated metrics in derivatives makes us be extremely cautious and think that we may be in market climax.
Last week we were looking for pullbacks to validate the bullish imbalance of the intermediate structure, however the market has refused to correct in the slightest leaving a severe overlap that we will analyze in detail. We continue to insist that we want to see an effective bullish imbalance of the intermediate structure. Such an imbalance has to be above the previous highs preventing the price from re-entering the range.
Bitcoin 13/11/23 4h chart

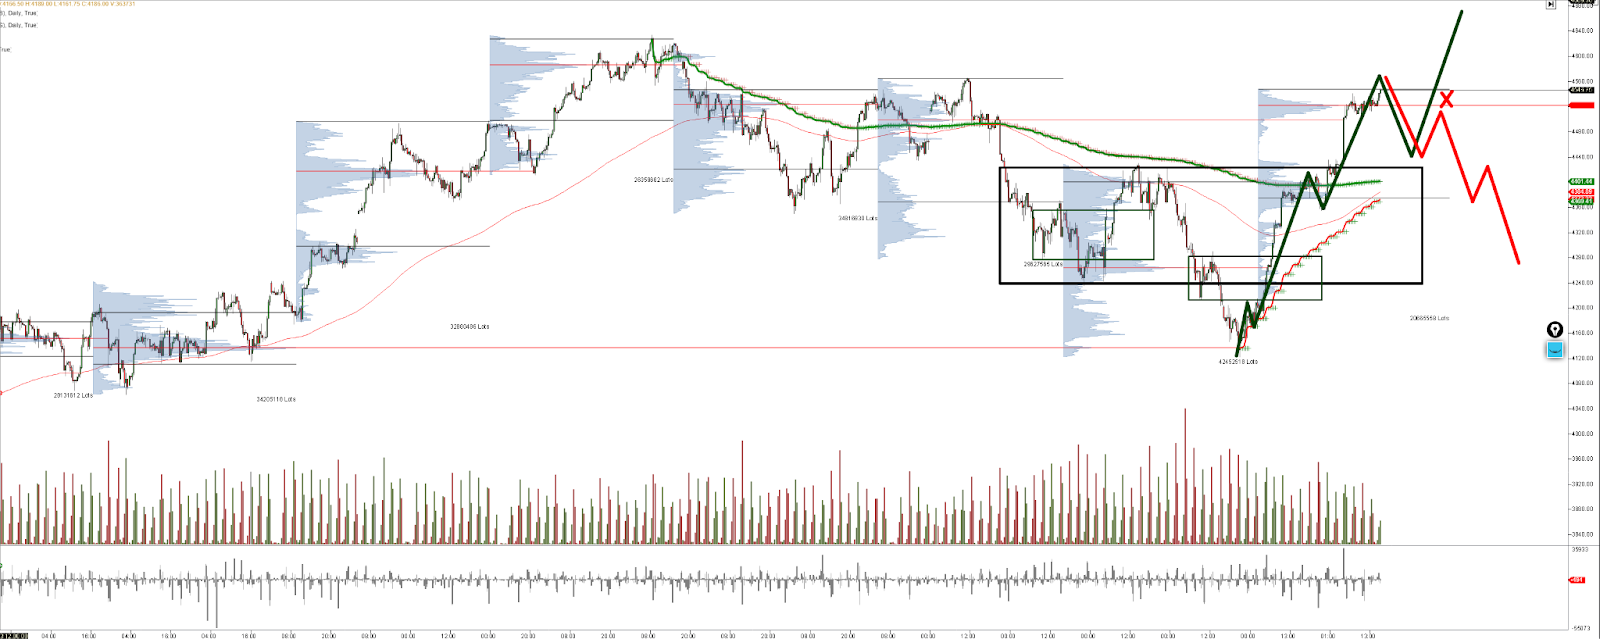
Bitcoin 20/11/23 4h chart
On a low time frame chart we see a steeply sloping value area, with a buy response at the bottom above $34500 but with a well marked sell initiative zone. We believe that the market is starting to be exhausted and the sell initiative zone is getting stronger. The key area for buyers is the VPOC at $34500, losing this area would trigger a sharp move to the downside. It seems to us certainly complicated that the market continues in this overlapped dynamic so we are very conservative in both bullish and bearish approaches, the areas to be conquered by the bulls and bears and initiate are clear.
Bitcoin 13/11/23 5 min chart
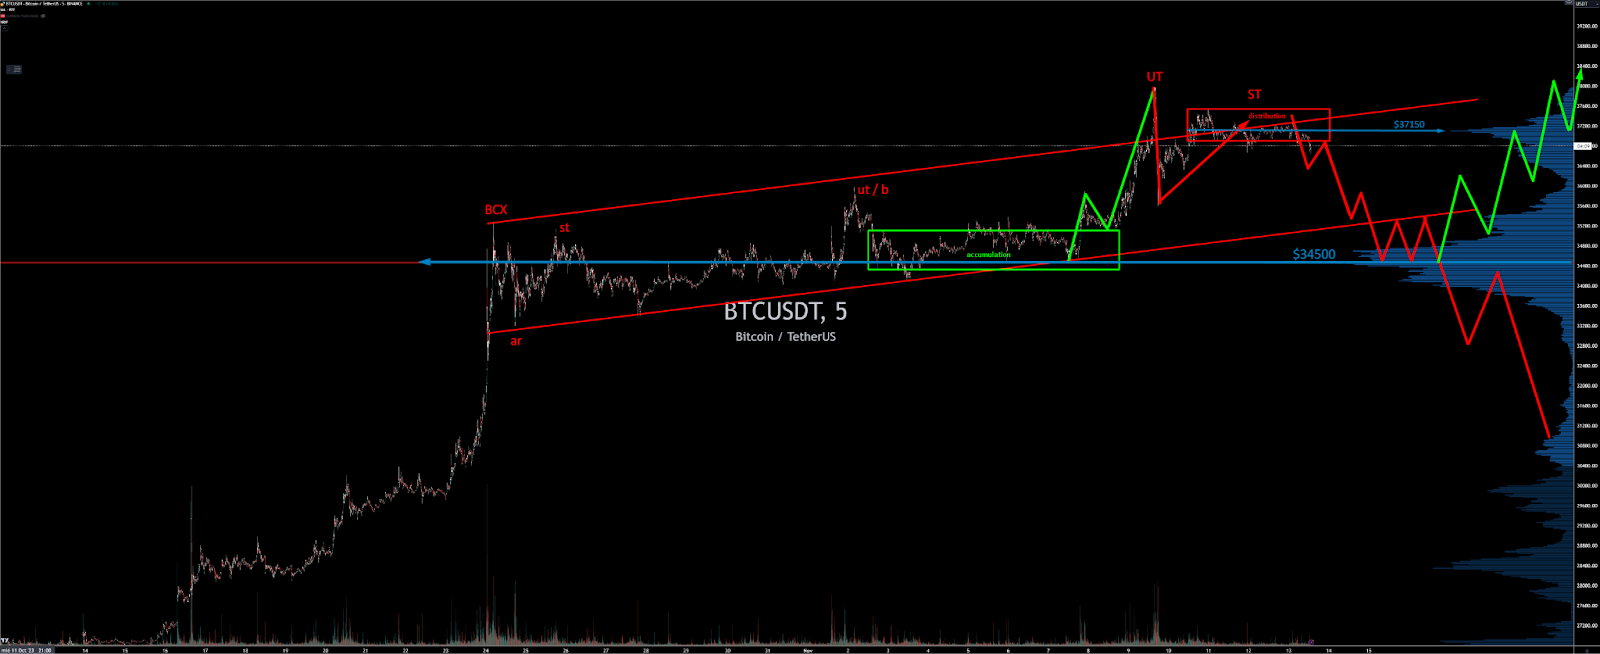
Bitcoin 20/11/23 5 min chart

Ethereum
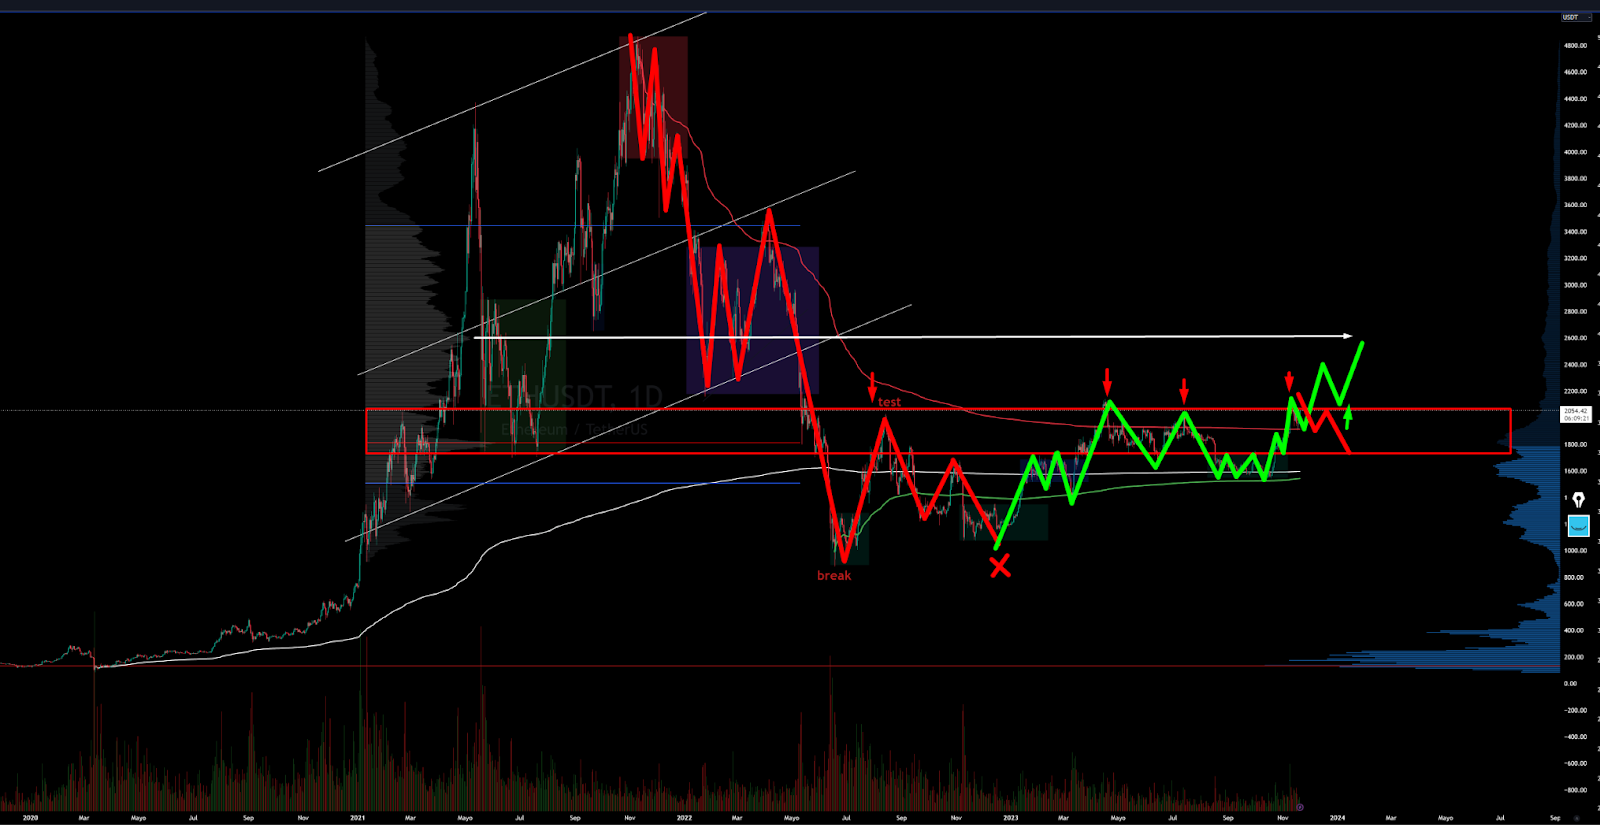
Ethereum price surged above $2,000 on November 9th, after BlackRock confirmed plans to launch an Ethereum Spot ETF in a NASDAQ filing. Ethereum’s price fell below the key $2,000 level last week, following weeks of aggressive rallying. Yet, a bullish continuation could not be written off yet, as the market is seemingly climbing back above the mentioned level.
Ethereum, after having remained for several weeks in the demand zone marked on the chart without any response, has finally managed to wake up from its lethargy. Right now we are in the sellers' initiative zone, which has previously left several rejections. The bulls must conquer this zone, reversing the rejection price action. A clear breakout and consolidation above this zone would open the door to a very promising long term bullish scenario.
Ethereum 13/11/23 4h chart

Ethereum 20/11/23 4h chart
Following the recent increase in Ethereum’s price, market participants have become optimistic about the mid-term future of the market. This has led to considerable buying pressure in both the spot and futures markets. The chart bellow demonstrates the funding rates, which are one of the most insightful metrics when it comes to evaluating the futures market sentiment. Positive values show bullish sentiment, while negative ones are associated with bearish sentiment.

It is evident that the funding rates have been showing significantly high values over the last few weeks. Meanwhile, a decline has recently started with the correction in price. Extremely positive funding rates are typically witnessed when the price reaches a high and is about to pull back or reverse.
The reason for this phenomenon is that with high funding rates, the risk for a long liquidation cascade increases drastically. As a result, investors should be cautious as the recent drop in price might be the beginning of a larger bearish phase.
Classic markets
We repeat what we have been saying in recent weeks:
“Inventive positive” catalyst (inflation back to target, no recession, no further rate hikes) => Crunch Vol + Buy Tech / Magma7 + Squeeze Options bearish positioning + YOLO (Xmas rally, presidential cycle, AI bull market, CTA max long, this time is different) => Sell Off => Repeat until something serious happens and really breaks something.
It should be clear to the reader that there is no “alpha” in buying Nvidia or the tech sector / Magma 7. It is the same trade as short VOL.
SPX vs SVIX (short VIX ETF)

NVDA vs SVIX

Microsoft (MSFT) vs SVIX

Cisco (CSCO) and Walmart (WMT) since reporting earnings last week vs SVIX. Ride the wave until reality hits you in the face.

The recent market squeeze was driven by a massive unwinding of hedges (gamma squeeze) and short positions, and that it does not reflect a fundamental improvement in the economic and geopolitical outlook, which remains highly uncertain and volatile. Major economic trends are shifting, which we believe will lead to a massive market reversal in the coming days and weeks.
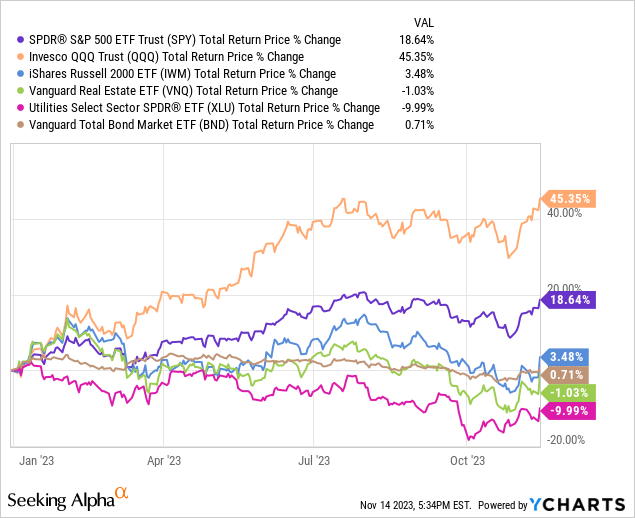
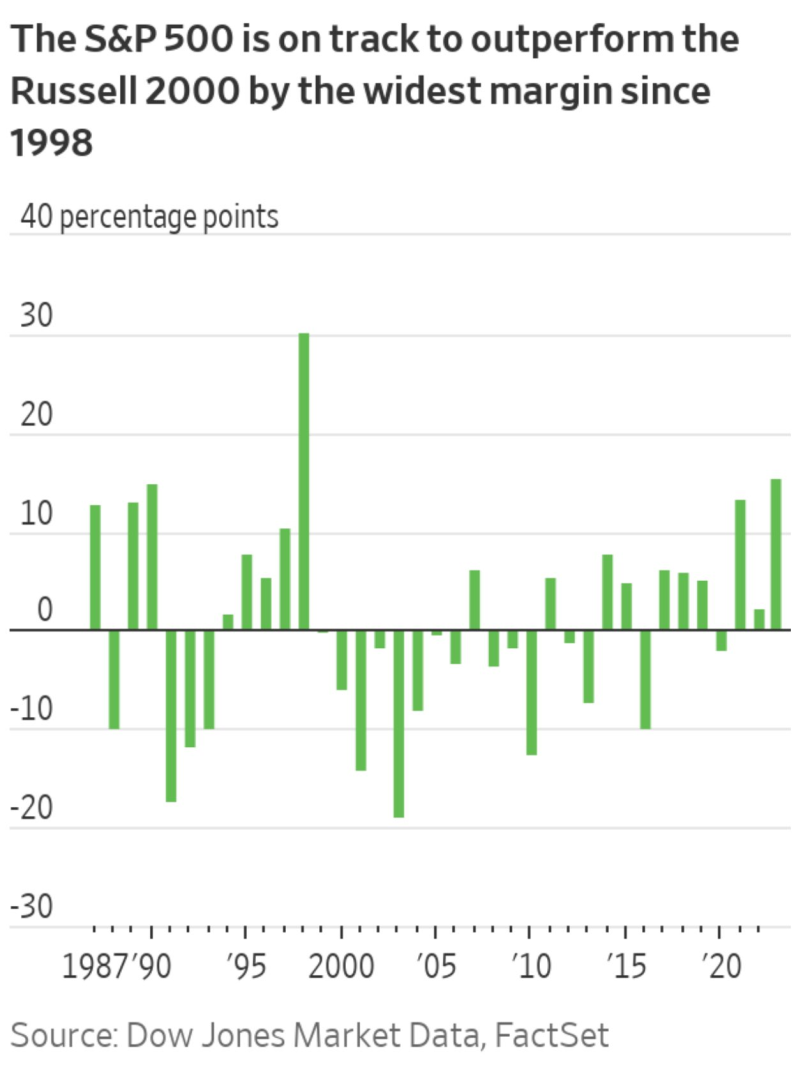
For the first 10 and a half months of 2023, the markets have experienced a massive bifurcation. Overall, it has been a very good year for the SP500, with the index up 19% year-to-date. However, underneath this strong performance is a tale of two segments:
- AI-related tech companies, particularly the "Magnificent Seven" (Apple, Nvidia, Tesla, Meta, Alphabet, Microsoft, and Amazon), have flown higher, as evidenced by the extremely strong performance from the Nasdaq (QQQ), which is even more dominated by these names.
- More defensive and interest rate-sensitive securities in the utilities (XLU), real estate (VNQ), and bond (BND) sectors have significantly underperformed. Moreover, smaller cap stocks (IWM) in general have significantly lagged behind the broader market as well.
The SP500 is poised to outperform the Russell 2000 by the widest margin since 1998.
The Magnificent Seven are wildly overvalued compared to history, even with the 10-year yield at its last Tuesday low of 4.44%. On this basis, even the other 493 collectively look a little expensive.

Why Defensive Dividend Stocks Have Underperformed In 2023
Dividend stocks, particularly Real Estate Investment Trusts (REITs), utilities, yield cos, and infrastructure businesses, have underperformed the SP500 this year primarily because of two major catalysts:
- They are not expected to benefit from the artificial intelligence boom nearly to the same degree that technology stocks, especially the mega-cap tech stocks, are. As a result, a lot of equity capital left these more boring names in favor of piling into the more exciting cutting-edge technology stocks such as the aforementioned Magnificent Seven and AI stocks.
- Interest rates have continued to rise and the surprising resilience of the economy and jobs market along with persistently hawkish verbiage from the Federal Reserve have shifted market expectations towards a higher for longer interest rate scenario.
Higher for long interest rates tend to hurt defensive dividend stocks for the following three main reasons:
- When interest rates rise, defensive and contracted cash-flowing investments like REITs, utilities, yield cos, and existing fixed-rate long-dated bonds become less attractive, as investors can invest in newly issued bonds at higher relative yields, making existing income investments less appealing in comparison.
- Many companies in sectors like utilities, real estate, and infrastructure rely on debt financing for their capital-intensive projects. When interest rates increase, their borrowing costs rise, which can negatively impact their profitability and, consequently, their stock prices as investors become wary of these companies' ability to generate returns in a higher interest rate environment.
- In a rising interest rate environment, investors tend to become more risk-averse. While dividend stocks in sectors like REITs and utilities are generally viewed as defensive investments, the perception of their risk can rise due to concerns about rising interest expense and competition from higher-yielding fixed-income assets as well as cash-rich mega-cap stocks.
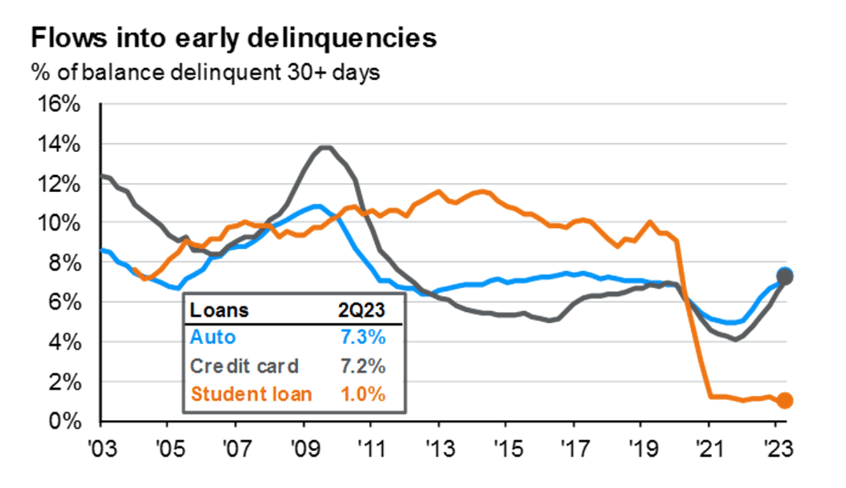
That being said, the market's outlook is in the process of shifting. Recent economic data indicates a slowdown is in the works, with inflation cooling significantly, job growth slowing, and consumer spending likely nearing its limits.
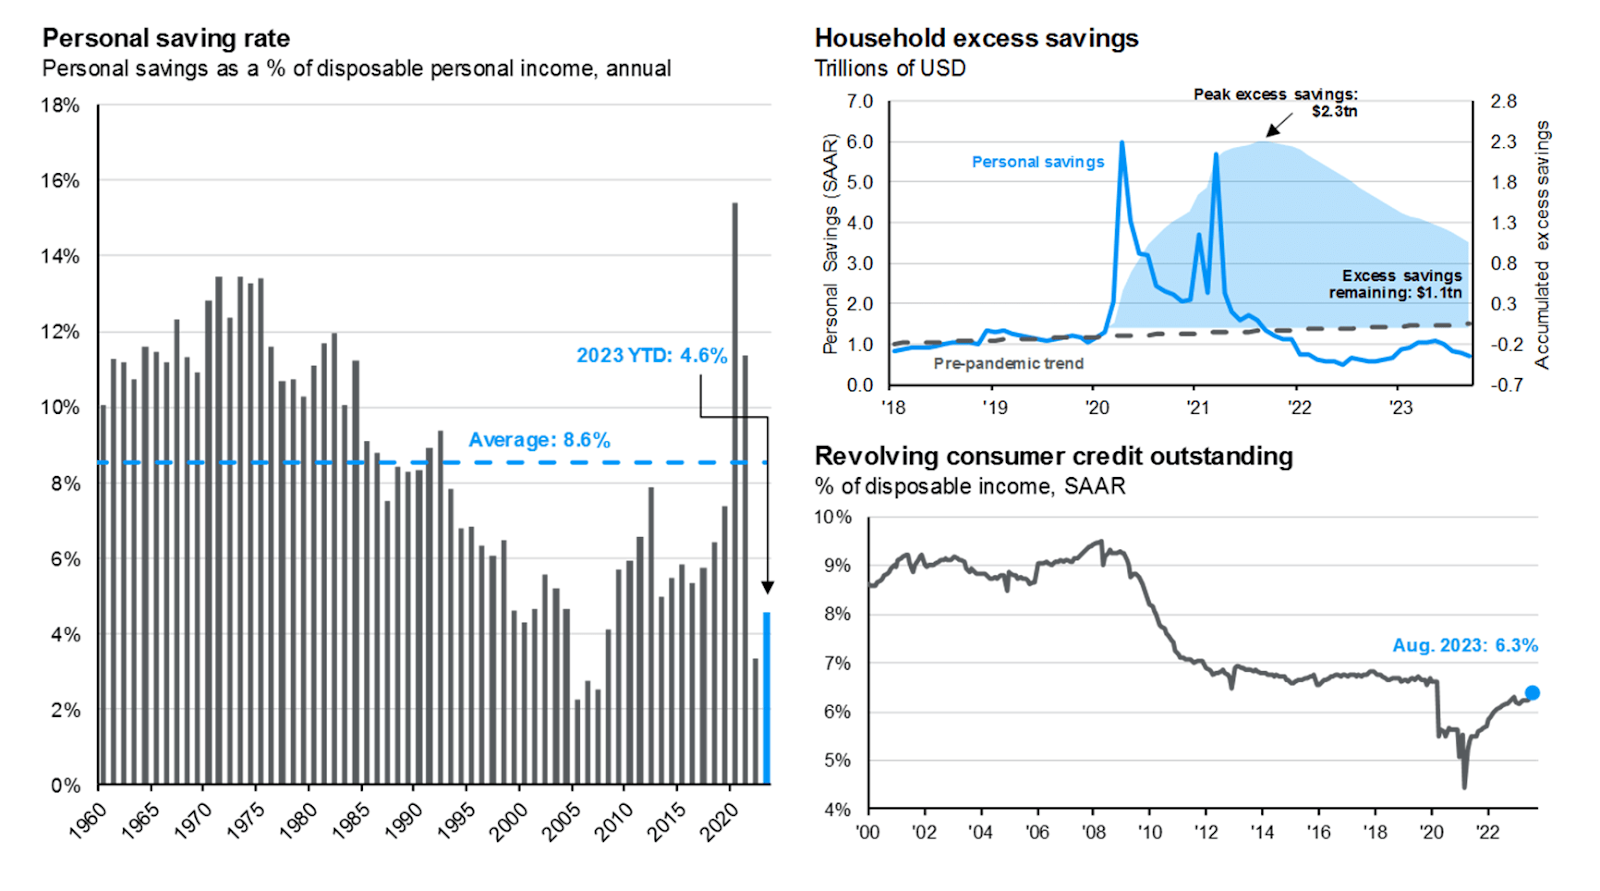
Moreover, car and credit card delinquencies are also increasing as 7% of borrowers are more than 30 days behind on their payments. Add to that student loans which resumed payments in October are expected to take out further 0.3% of consumer spending and the picture becomes somewhat grim.
The Federal Reserve's preferred personal consumption expenditures price index reported a 3.44% inflation rate in September, reflecting a continued decline from its peak in July 2022. Moreover, the headline CPI number in October came in lower than expected at 3.24%, implying that the economy may be cooling even faster than was previously expected.
Moreover, the jobs market appears to be weakening. The recent U.S. jobs and wages data for October 2023 indicates that the job market may be weakening. For example, job growth slowed, with the 150,000 new jobs added falling short of expectations and marking a deceleration in employment gains. Meanwhile, the unemployment rate has also ticked up slightly to 3.9% while real wages have decreased by 5.8% compared to the previous year, signifying that wage growth is not keeping up with inflation.
Last, but not least, U.S. consumer sentiment fell for the fourth consecutive month in November as the University of Michigan's Consumer Sentiment Index dropped to its lowest level since May. Moreover, when combined with the recent depletion of excess savings accumulated by U.S. households during the COVID-19 pandemic and a significant rise in consumer credit card debt (now at a record level of over $1 trillion), it appears likely that there will be a meaningful decrease in consumer spending moving forward.
A weaker consumer could jeopardize the ability to hit EPS targets for the index. Currently, consensus is very optimistic calling for double-digit EPS growth in 2024 and 2025. That's almost double the historical average. And if consumer spending slows and we slip into a recession, it's quite unlikely that these targets will be hit.

As a result of these factors, the Federal Reserve is very likely finished with hiking interest rates, and we expect that long and short-term interest rates are probably going to begin falling before too long. Moreover, the stock market will likely shift towards favoring more defensive stocks in the near future as the economy increasingly appears headed for a recession.
NVIDIA earnings, the catalyst of the week
Nvidia will report Q3 earnings on November 21 to high expectations. The tech giant is expected to announce revenue of $15.99B for the quarter and EPS of $3.37. Key topics from the Santa Clara-based company will be the impact of China export controls, the product roadmap, the update on the data center supply chain, hyperscale commentary, and color on AI services revenue. Nvidia heads into earnings day on a hot streak, with shares already up 240% year-to-date. Options trading implies a swing in share price up or down of 8% for Nvidia after the earnings report drops.
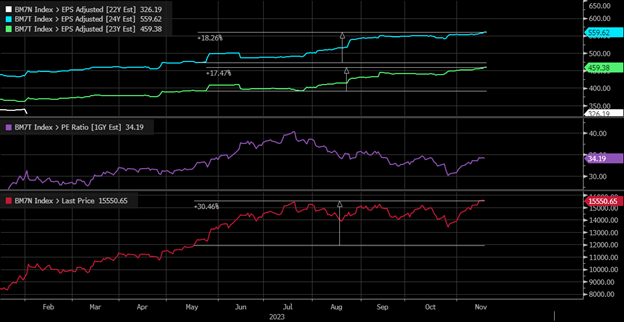
Nvidia's earnings carry a lot of weight for the entire market because expectations for earnings growth from Nvidia drive much of the success of the Magnificent Seven and, thus, the SP500. If you want to know why the Magnificent Seven has outperformed this year, it is primarily because of expected earnings growth of some 40% this year and then by 22% next year. This is the only part of the SP500 growing at this pace, especially considering the S&P 500 is expected to see no growth in 2023 and about 10% growth in 2024, based on the Bloomberg Magnificent 7 index. The S&P 500 equal weight index is up less than 5%.
Since the middle of May, when Nvidia reported the blowout earnings report and gave significantly higher than expected guidance, earnings estimates for the group have increased by 17.5% for this year and 18.3% for next year. This, plus some multiple expansion, has helped to drive the Magnificent 7 index higher by around 30%.
Since the middle of May, earnings revisions for most of the companies have been modest, and perhaps surprisingly, Apple, Microsoft, and Alphabet have seen hardly any upward revisions to their forecast, while Tesla has seen its earnings forecast slashed. Meta has seen healthy upward revisions, and anyone who has followed Amazon long enough knows that earnings growth from the company is not dependable. The only company that has seen a huge and outsized increase in earnings revisions is Nvidia. Nvidia's earnings estimates since its May earnings reports have risen by almost 140% for fiscal year 2024 and 190% for fiscal year 2025.

Therefore, it seems pretty logical to assume that almost all of the increase in earnings estimates we have seen in the Magnificent Seven has come from Nvidia since the rest of the index is not delivering much, if any, increase in earnings revisions since the middle of May. Additionally, Nvidia accounts for about 25% of the overall growth in the total index from this year to next year. This tells us just how important Nvidia has become to the story of the Magnificent Seven and, more importantly, how vital guidance from the company will be when it reports results this week. It will need to support the current earnings estimates and, more importantly, be better than expected to drive earnings growth higher to help propel the market further to the upside.
Sentiment and exposure metrics: extreme readings, all in!!
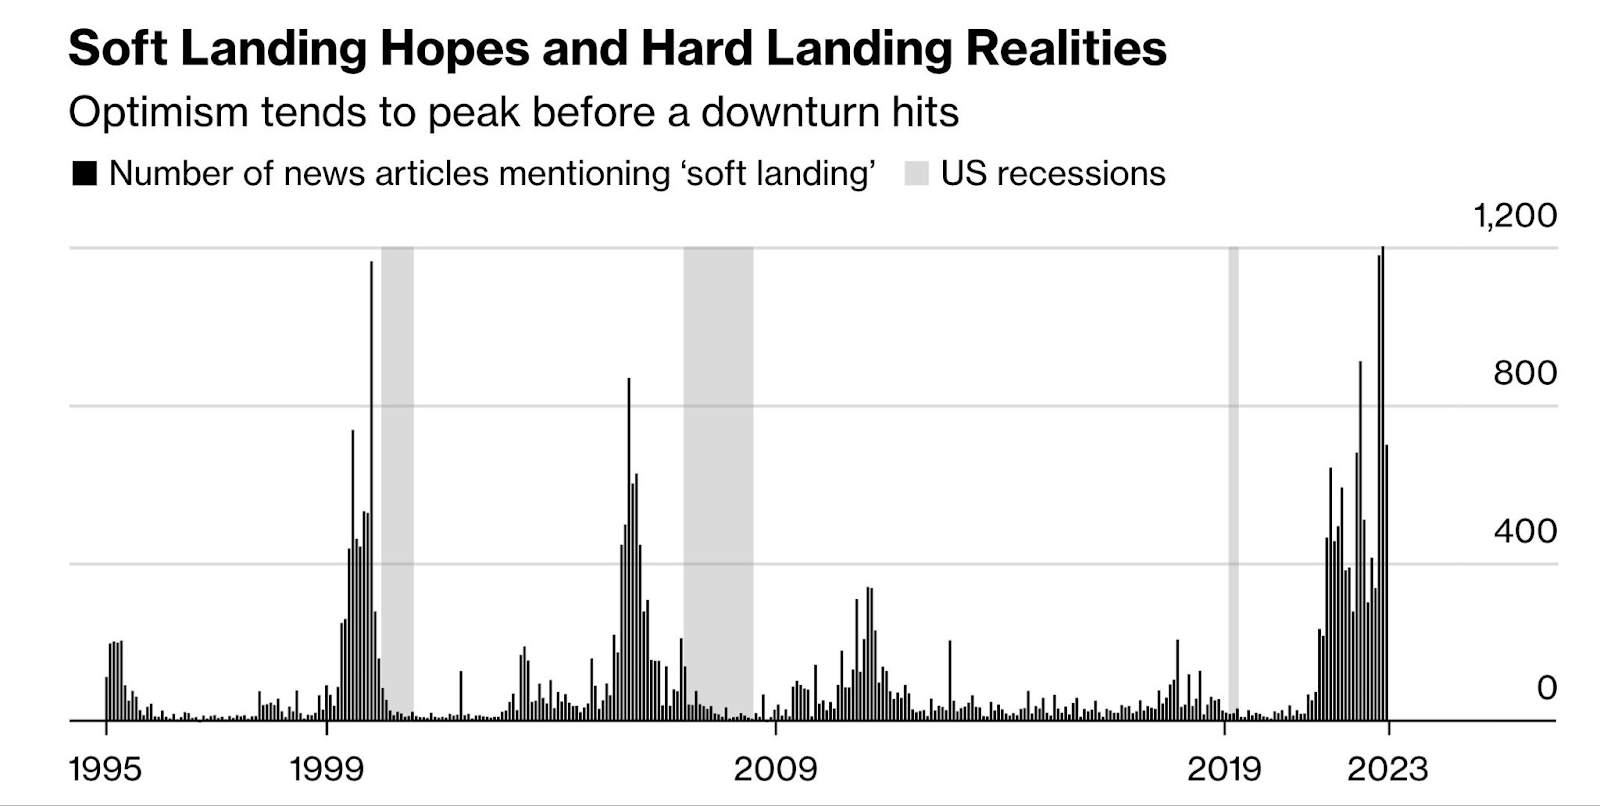
When companies start referencing soft-landing as frequently as they are now, it is usually a triumph of hope over reality and a hard landing is just around the corner.

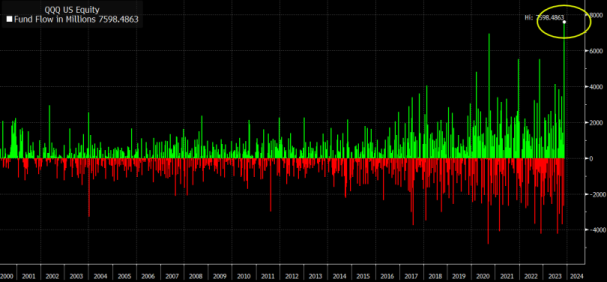
The ETF flows last week can best be described as “we are so back”. QQQ has taken in $7.6 billion since Monday, more than any week since its launch in 1999.
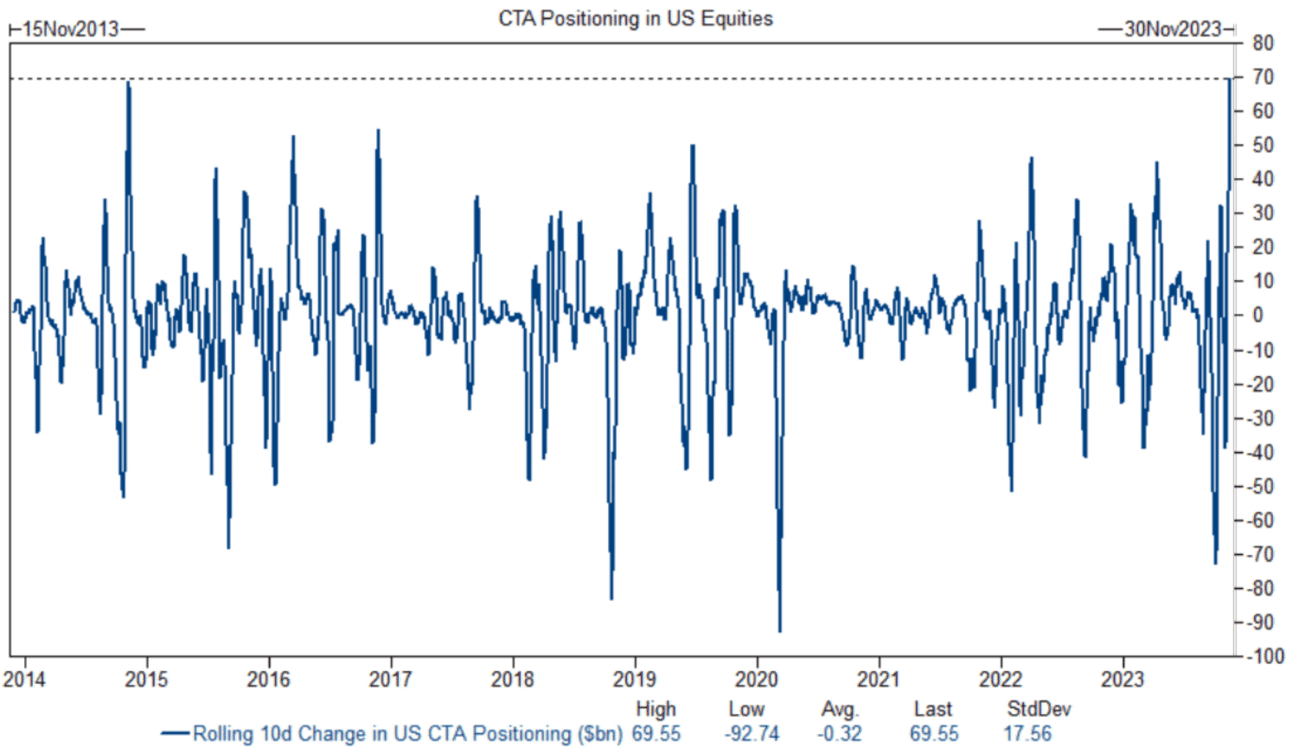
Over the last 10 days, CTAs have bought nearly $70bn US equities, this is the largest 10d buying we have on record according to Goldman Sachs.
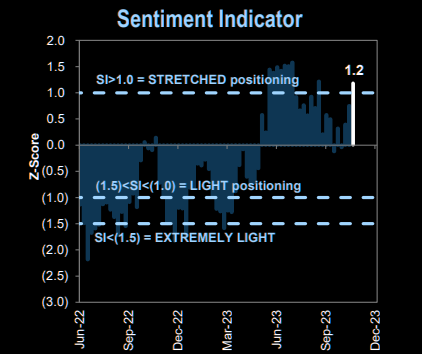
Hedge Funds crowding in Megacap Tech is about as extreme as it can get and clearly a different picture than the beginning of the year.

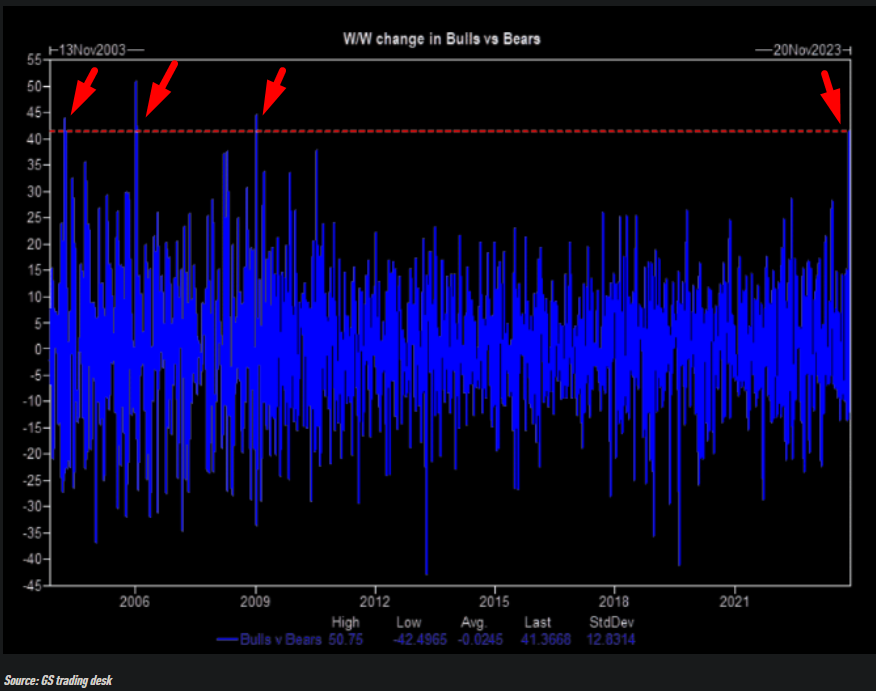
This is the largest week on week flip in bullish sentiment on record (only 2001 and 2008 saw larger weekly flips).
FinTwit Equity Sentiment Poll most bullish since 2021.

Most shorted basket deja vu.

Options, Gamma, IV, SKEW
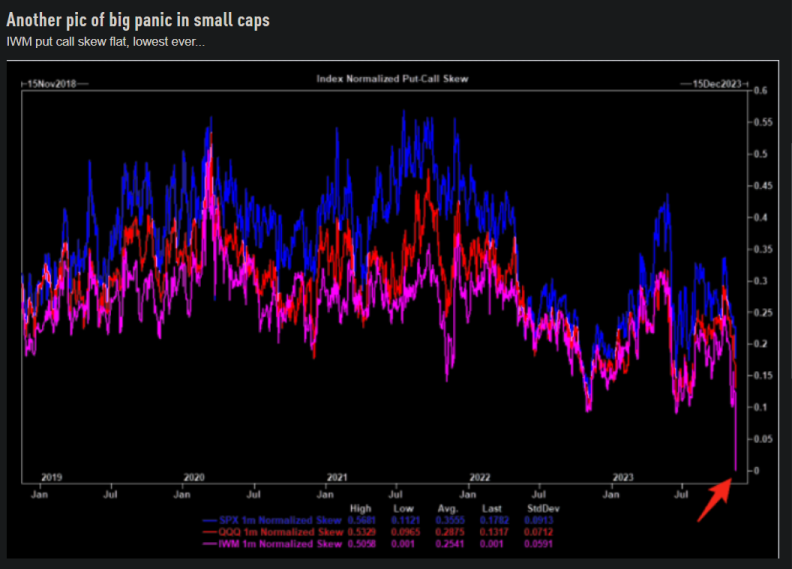
Who needs downside protection when the market only goes up? Skew just printed the lowest levels in a while as the SPX has surged. Previous "pukes" in skew have been marked with a short term top in the SPX.

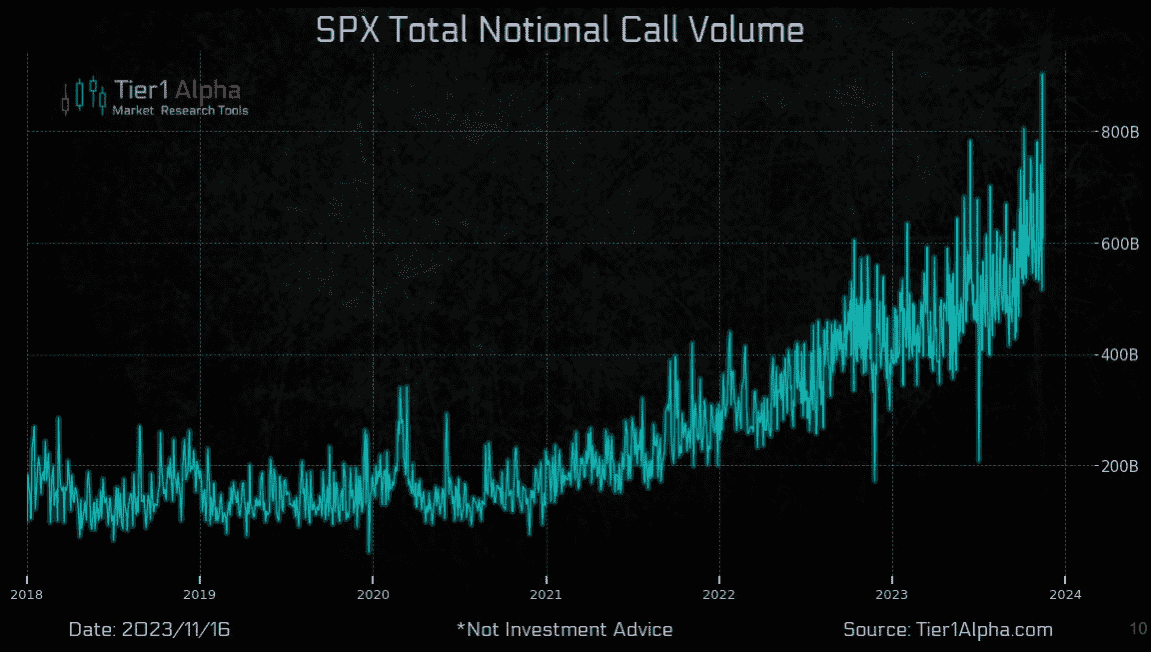
US Equity Call Volume at an All-Time High. The mother of all bubbles is back once again. FOMO chasing has sent call options to new highs.
IWM call volume with record high per Goldman Sachs.

Friday concluded the November monthly opex (options expiration). On a mechanical level, part of what helped to make 4500 such a strong pin was the forces of vanna and charm pushing the price toward it from both directions as those wider strikes dissolved. The equity market will now need to reconcile an unpinning of this heavy draw from 4500, which sucked the price action in at the peak of the November opex on Friday.

What usually happens next is that the high amount of call gamma we just saw expire would be destabilizing for the market, establishing fragility. This makes the equity market more vulnerable to breaks, especially in the first few days.

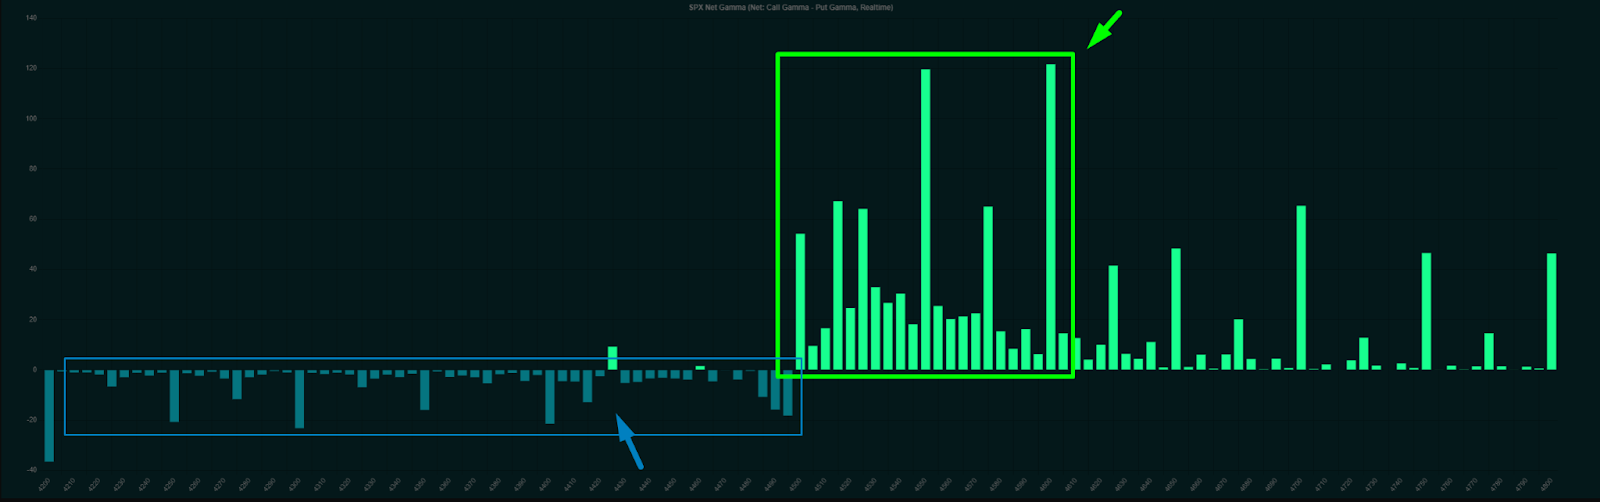
Post OpEx the first thing that we note is that:
- The option chain is clearly skewed toward call gamma, showing that post expiry the market sentiment remained strong.
- We can also see that the Call Resistance level has shifted higher. That is usually a positive sign for the market, and in this case supports the Santa rally into the year end.
- The prevailing FOMO has succeeded in making the options market believe that there is no risk, note the total absence of gamma exposure on the OTM put side. There is no higher risk situation in which the risk is not perceived. The market is clearly swimming naked, ignoring tail risk as it has never done before.
- At the end of October, readings on implied volatility (IV) indicated a large divergence with respect to the behavior of the SPX, the risk-off was coming to an end. Thereafter, what the market has liked the most since the end of last year, Crunch vol, Squeeze bearish positioning and Long tech / Magma 7. The market is only SHORT VOL and certainly in our view the trade is overcrowded and exhausted.

Market Comment
Bear market rallies are notoriously violent and abrupt. And this last one was among the most violent and abrupt of them all. There is no greater risk situation in which the risk is not perceived. The prevailing market dynamics have managed to make the rest of the participants believe that there is no risk in sight and that softlanding is possible.
However, the latest Conference Board Leading Economic Index (LEI) fell for a 19th consecutive month in October as the LEI resumed signaling a recession in the near term. The index dropped 0.8% from last month to 103.9, the index's lowest reading since May 2020.
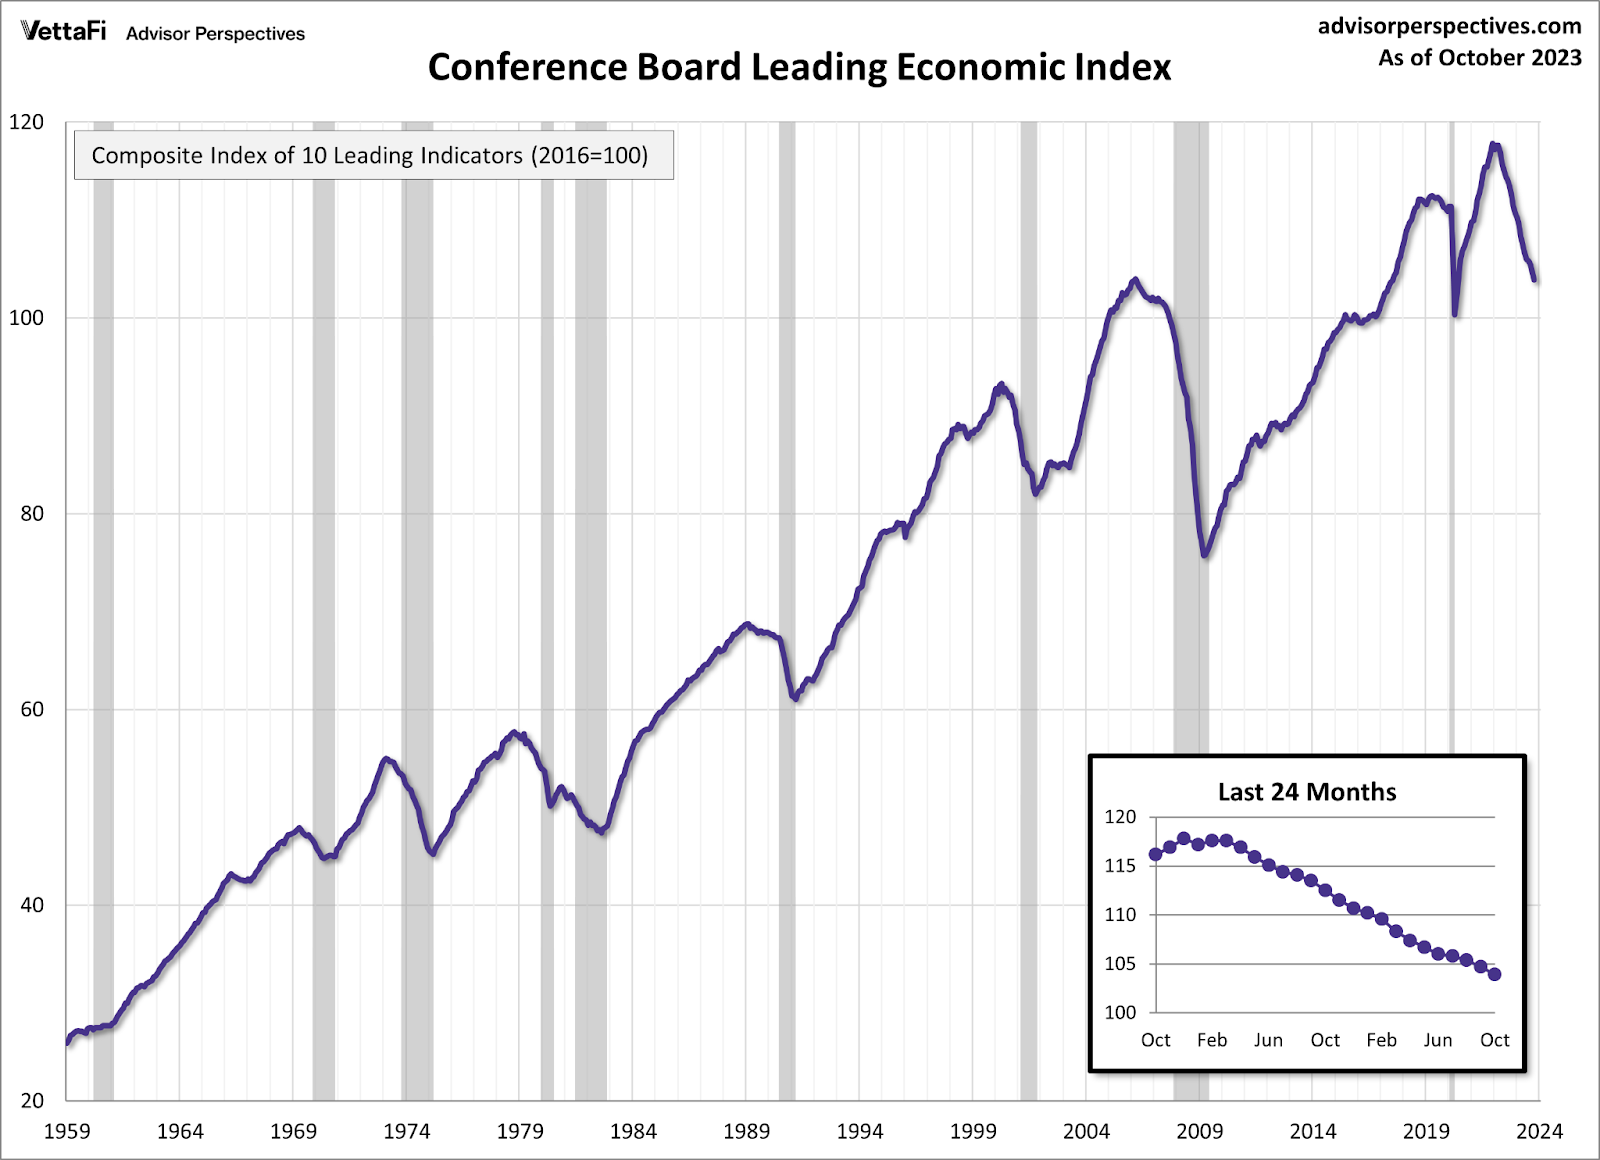
For a better understanding of the relationship between the LEI and recessions, the next chart shows the percentage off the previous peak for the index. We are currently 11.8% off the 2021 peak. The chart also calls out the number of months between the previous peak and official recessions. On average, there is usually 10.6 months between a peak and a recession. We are currently 22 months off from the 2021 peak.

Although the reader may think that the last three week's rally is due to a real show of buying strength, unfortunately this is not the case. An epic gamma squeeze of short positions drove stocks higher three weeks ago along with last week's "positive" CPI data that caused a rotation of the gamma stack to higher levels before OPEX, allowing the market to stabilize and consolidate the market “vanna rally”.
ES_F 4h chart 13/11/23
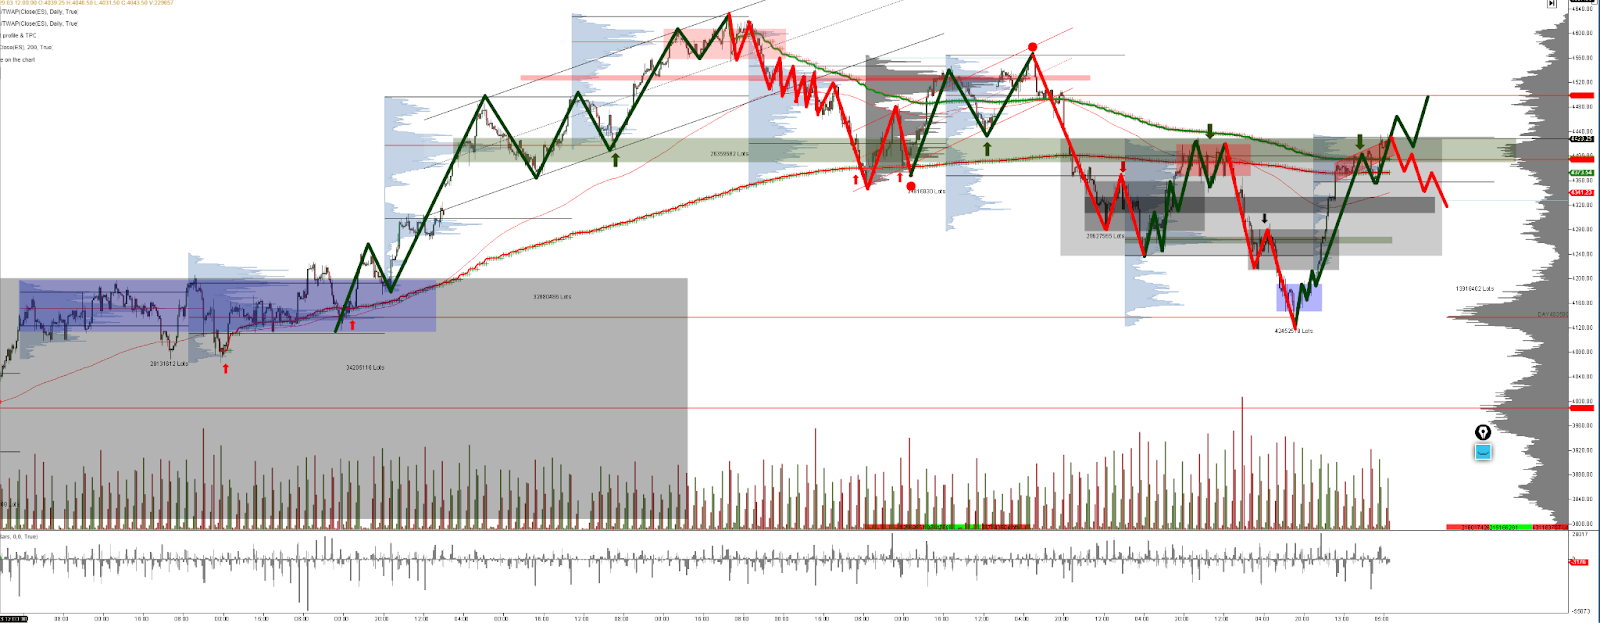
ES_F 4h chart 20/11/23

The market has taken its opportunity to consolidate the gamma short squeeze in the face of the past OPEX, however in terms of dynamics, the situation is clear, if the market has really managed to reaccumulate the structure marked on the lower chart, it must present an effective imbalance. We look for retracements in the coming sessions/weeks to validate a bullish imbalance or an abrupt return to value. The June Vpoc (control zone marked in green) and the Vwaps confluence zone on the chart above will be the key area for bulls and bears.
We are firm in our opinion that all this upside movement initiated at the end of October does not respond to a healthy and well auctioned market. The following chart shows how the volume profile for the month of October presents a disastrous auction, full of gaps and inefficiencies. We believe that sooner or later all of this will be fully repaired.
It is not how far the market is able to go but how it has done it.


